

HORMUZ TALKS STALL AS INDIA ENTERS RBI WEEK WITH OIL, RUPEE AND YIELDS TIGHT
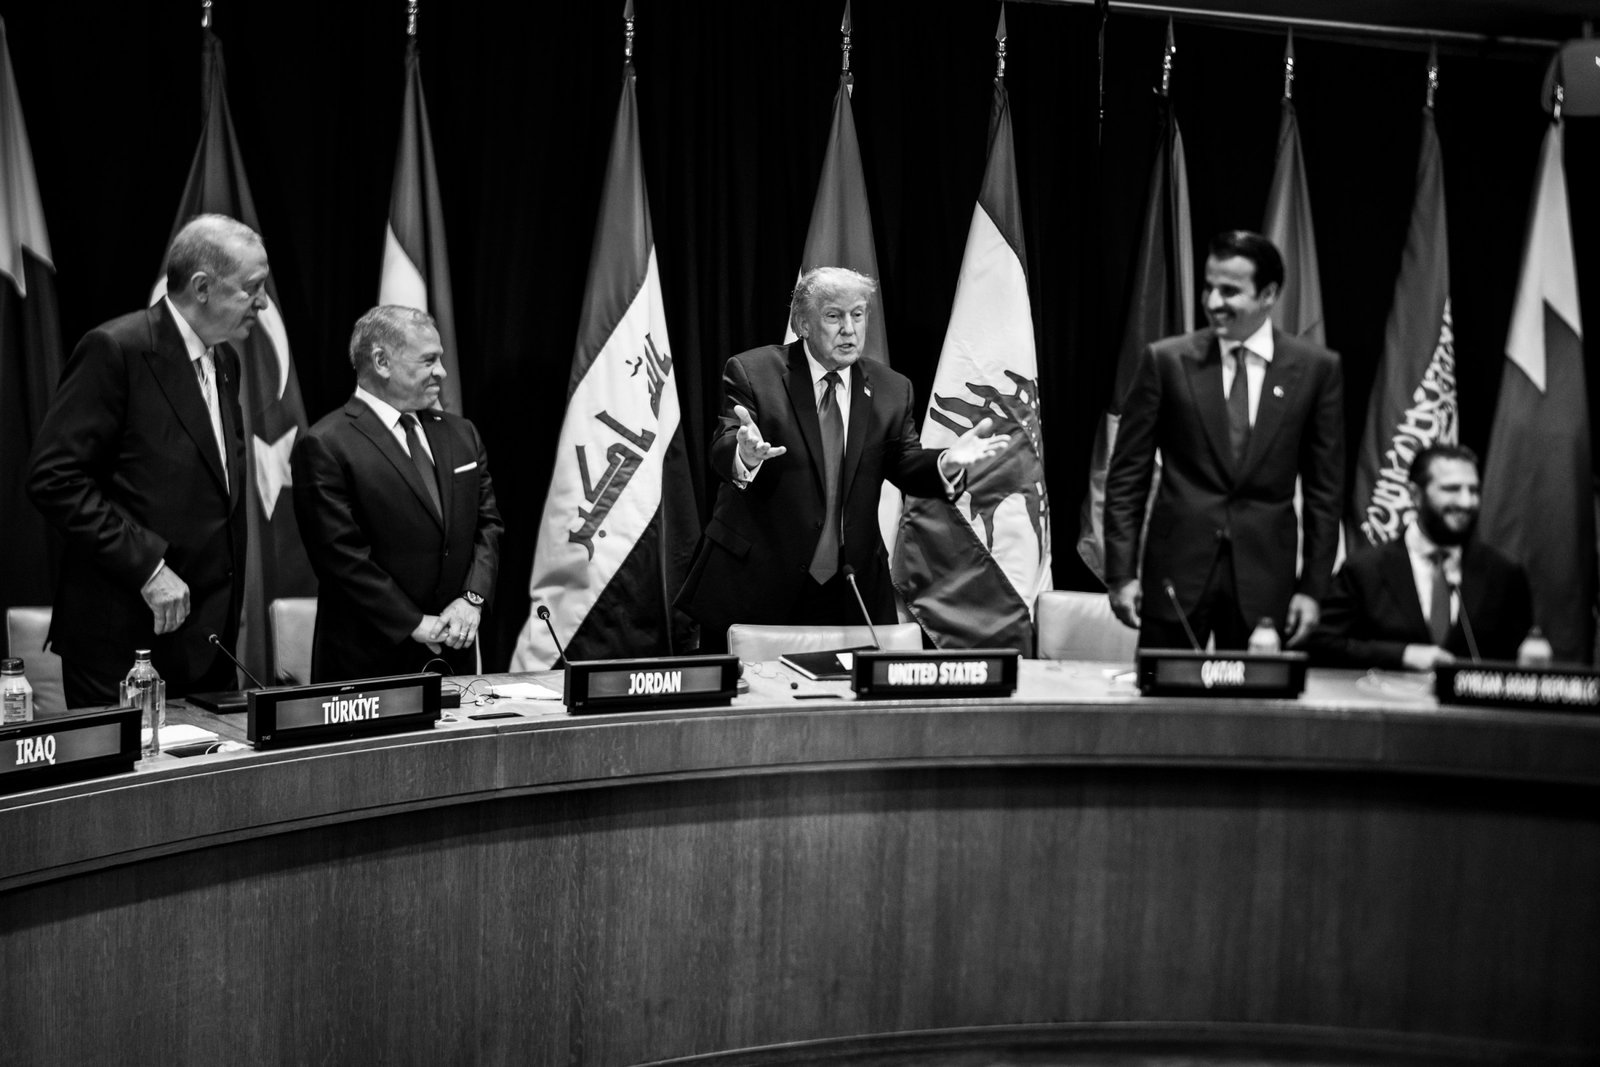
Iran said on Sunday that diplomacy remained the route to resolving the conflict after the United States rejected Tehran’s proposal to reopen the Strait of Hormuz and end fighting. For India, the external shock meets a still-firm domestic activity pulse. The rupee closed at 95.8125 per dollar, the benchmark 10-year yield at 7.1194%, and September flash Composite PMI strengthened to 56.5.
India’s market signal deteriorated again, but the real-economy signal did not. Nifty lost 0.9% and Sensex 0.5% over the week, their seventh straight weekly decline. Brent settled at $104.32, while India’s 10-year yield ended at 7.1194%. At the same time, August core industries rose 4.8%, September flash Composite PMI rose to 56.5 from 54.3, and August total exports were estimated at $82.68 billion, up 25.41% year on year. Full-year dated-security borrowing is planned at Rs 15.995 trillion versus the Rs 17.2 trillion Budget estimate.
Continue the publication series through the Alborithm newsletter archive and podcast archive.
02 | Headline Analysis
The cross-asset picture is more demanding, but it is not yet a one-factor domestic slowdown. Oil raises the external balance and imported-cost hurdle. Global yields raise the discount-rate floor. RBI liquidity withdrawal operates through another channel and reduces the assumption that surplus liquidity will absorb every external shock.
A softer alternative remains possible. If diplomacy improves physical flows and freight quickly, oil can retreat while Indian activity and exports remain firm. A durable improvement in Brent, the rupee, India and US long yields, and broader equity participation would weaken the stress thesis. One session alone is not sufficient evidence.
Read Issue 002 and compare the prior week’s transmission framework →
03 | Markets & Macro Dashboard
| Indicator | Latest observation | Read-through |
|---|---|---|
| Nifty 50 | 23,140.50 | -0.9% WoW | Seventh weekly decline |
| BSE Sensex | 73,895.74 | -0.5% WoW | Large-cap risk appetite remained weak |
| USD / INR | 95.8125 | 25 Sep close | Little changed on the week |
| India 10Y | 7.1194% | +5 bps WoW | Term premium remained firm |
| Brent crude | $104.32/bbl | 25 Sep | Oil remains above $100 |
| FX reserves | $765.90bn | w/e 18 Sep | Large buffer, down $14.88bn WoW |
| Core industries | +4.8% YoY | Aug | Activity remains resilient |
| Flash Composite PMI | 56.5 | Sep | Three-month high |
04 | Global Economy & Geopolitics
Oil remains the bridge between regional security and Indian macro conditions. Brent fell about 2% on Friday as negotiation hopes emerged, but the physical-flow system remains fragile. For India, the relevant question is not the political narrative itself. It is the delivered cost of crude, freight and insurance, and whether those costs keep dollar demand and inflation expectations elevated.
The global rates channel tightened at the same time. The US 10-year Treasury yield topped 5.20% intraday during the week, while India’s benchmark 10-year ended at 7.1194%. Higher global term yields raise the valuation hurdle for duration-sensitive Indian assets even when domestic growth remains firm.
Brent closed at $104.32. The key test is whether freight and delivered cost fall with the benchmark.
US 10Y above 5.20% intraday keeps the external discount-rate floor elevated.
Rupee, inflation, bond yields and earnings margins remain the main downstream channels.
Negotiation headlines can move risk premia; the macro read changes only with verified flow and price consequences.
05 | India Macro & Liquidity Radar
Core industries grew 4.8% in August and September flash Composite PMI rose to 56.5. Inflation remains elevated at 4.82% CPI and 9.92% WPI, while oil and the rupee keep imported-cost risk visible.
Reuters reported that RBI bond sales, FX operations and reverse repos reduced the banking-system surplus to Rs 4.92 trillion from a record Rs 11.16 trillion. This is evidence of operational tightening, not proof of the next policy-rate decision.
GLOBAL YIELDS | RBI LIQUIDITY | INDIA 10Y | CREDIT / FX | INFLATION / GROWTH
The fiscal channel provides an important counterweight. H2 FY27 gross dated-security borrowing is planned at Rs 7.86 trillion, while full-year borrowing is planned at Rs 15.995 trillion versus Rs 17.2 trillion in the Budget estimate.
06 | Rules, Policy & Release Calendar
| Regime / release | Status | Next watch |
|---|---|---|
| RBI liquidity | Surplus reduced to Rs 4.92tn through OMO, FX and reverse-repo actions | How much further liquidity is drained |
| FX reserves | $765.90bn, w/e 18 Sep | Whether drawdown stabilises |
| H2 borrowing | Rs 7.86tn; full-year Rs 15.995tn | Auction absorption across maturities |
| Activity | ICI +4.8%; flash PMI 56.5 | Final PMI and September output |
| Inflation | CPI 4.82%; WPI 9.92% | Whether input pressure broadens into retail prices |
07 | Research & Data Brief
Two evidence sets can coexist. Financial conditions have tightened through oil, global yields, domestic term yields and repeated equity weakness. At the same time, infrastructure output, survey activity and exports remain positive. The research task is to monitor which side begins to dominate household inflation, corporate margins and credit conditions.
Higher delivered energy costs raise dollar demand; reserves and capital flows influence how much becomes rupee volatility.
Core industries +4.8% and flash PMI 56.5 argue against an immediate domestic-demand break.
WPI 9.92% versus CPI 4.82% keeps the pass-through gap central.
Pricing power, hedging, import intensity and leverage determine how companies absorb higher landed costs.
Global long yields plus domestic liquidity withdrawal raise the hurdle rate for duration-sensitive assets.
The lower full-year borrowing plan is a concrete counterweight to some bond-supply pressure.
08 | Company Research Lab | State Bank of India
State Bank of India is used as an analytical transmission case for this week’s rates and liquidity theme, not as a recommendation. Q1 FY27 net profit was Rs 21,121 crore. Whole-bank loan growth was 18.63% year on year, deposits grew 9.73%, domestic NIM was 3.0%, and the gross NPA ratio improved to 1.47%. SBI also benefited from FCNR(B) mobilisation under the RBI’s concessional swap framework.
The key question is whether strong credit growth and FCNR(B) funding can offset deposit repricing and a higher sovereign yield curve without eroding margins or asset quality. At the 25 September snapshot, SBI traded near 10.5x P/E and 1.5x P/B. These are point-in-time market multiples, not a fair-value conclusion.
09 | Global-to-India Transmission
India’s immediate macro risk is a correlated move across oil, FX and rates rather than any single variable. At the company level, dispersion should remain large. Import intensity, energy consumption, pricing power, hedging, leverage and balance-sheet duration determine whether the same macro shock damages margins, raises discount rates, or is largely absorbed.
10 | Signals, Risks & Monitoring Radar
| RED | EQUITY BREADTH | Seventh straight weekly decline; Nifty -0.9%, Sensex -0.5%. |
| RED | OIL | Brent $104.32; imported-energy sensitivity remains elevated. |
| AMBER | INR | 95.8125 per dollar; stable week on week but still close to 96. |
| AMBER | INDIA 10Y | 7.1194%; sixth weekly bond loss. |
| AMBER | RESERVE USE | $765.90bn; latest reported week fell $14.88bn. |
| GREEN | ACTIVITY | ICI +4.8%; flash PMI 56.5. |
| GREEN | EXPORTS | August total exports estimated +25.41% year on year. |
| GREEN | FISCAL SUPPLY | Full-year borrowing below the Budget estimate. |
11 | Scenario Matrix
Brent remains around current elevated levels, INR stays orderly near 95 to 96, India 10Y remains above 7%, and activity stays firm. Equity multiples remain under pressure without a sharp growth break.
Oil rises again, global yields remain high, INR weakens beyond the recent range and wholesale pressure broadens. Domestic yields rise further and earnings warnings become more widespread.
Oil and global yields retreat, the reduced borrowing profile supports the local curve, INR firms, and strong activity and export data regain influence over market pricing.
Scenario weights are editorial monitoring weights, not statistical probabilities.
12 | Continuity, Revisions & Forward Intelligence
Issue 002 framed the week as a test of whether oil, INR, inflation and rates would deteriorate together. The next observation partly confirmed that framework. India 10Y rose to 7.1194% and equities logged a seventh weekly decline, while INR finished little changed and Brent closed modestly below the prior issue’s level. The signal was tighter financial conditions, not uniform worsening in every channel.
| Date / cadence | Event | Why it matters |
|---|---|---|
| 28 Sep | August IIP scheduled release | Tests whether broader industrial output confirms core-sector resilience. |
| Daily | Brent, Gulf physical flows and freight | Direct external-price and logistics channel. |
| Daily | USD/INR and RBI operations | Shows whether external stress requires heavier smoothing or liquidity action. |
| 7 Oct | RBI policy review | The policy decision must be separated from current market expectations. |
As of the 18:30 IST cut-off, Sunday diplomacy had not removed the Hormuz risk premium. India therefore enters RBI week with a split signal: resilient domestic activity, but tight oil, FX and bond-market conditions.
A thesis change should require broader, persistent transmission across oil, FX, yields, inflation and activity. Stronger September PMI and lower-than-budgeted borrowing are meaningful offsets, not immunity.
- MoSPI / PIB | Q1 FY2026-27 real GDP +7.8%.
- PIB, Ministry of Commerce & Industry | August 2026 core industries +4.8%; Apr-Aug +4.3%.
- HSBC / S&P Global, reported by Informist | September flash Composite PMI 56.5; manufacturing 55.7; services 55.8.
- MoSPI / Office of Economic Adviser | August CPI 4.82%; August WPI 9.92%; fuel and power WPI 22.93%.
- Reuters / exchange close data | 25 Sep Nifty 23,140.50; Sensex 73,895.74; seventh weekly decline.
- Interbank historical data | 25 Sep USD/INR 95.8125.
- Reuters / ICE settlement | 25 Sep Brent $104.32/bbl; WTI $92.41/bbl.
- Reuters / government securities close | 25 Sep India benchmark 10Y yield 7.1194%; +5 bps on week.
- RBI data, reported by PTI / Business Standard | FX reserves $765.901bn for week ended 18 Sep.
- Reuters | RBI operations reduced banking-system liquidity surplus to Rs 4.92tn from Rs 11.16tn.
- Ministry of Finance / PIB | H2 FY27 gross dated-security borrowing Rs 7.86tn; full-year Rs 15.995tn vs Rs 17.2tn Budget estimate.
- Ministry of Commerce & Industry / PIB | August total exports estimated $82.68bn, +25.41% YoY; Apr-Aug $399.27bn, +15.55%.
- Reuters | US 10Y Treasury yield topped 5.20% intraday during the week.
- Reuters, 27 Sep | Iran said diplomacy remained the route to resolving the conflict after the U.S. rejected Tehran’s Hormuz proposal.
- Reuters | SBI Q1 FY27 PAT Rs 21,121cr; loan growth 18.63%; domestic NIM 3.0%; GNPA 1.47%.
- Market close / valuation snapshot | SBI NSE close Rs 983 on 25 Sep; P/E about 10.5x and P/B about 1.5x.
- Reuters | Rupee, oil and RBI intervention and liquidity operations remained closely linked during the week.
- Alborithm Research | Cross-asset transmission, alternative case, scenario signposts and falsification rules.
- Issue control | Issue #003 / ISO Week 39; research and data cut-off 27 Sep 2026, 18:30 IST (13:00 UTC).
- Visual control | Original Alborithm logo retained; approved real-world Gulf tanker and terminal cover photograph; no artificial image and no India map used.

Subscribe to alborithm
Get new documentaries, articles and podcasts directly in your inbox.