


HEADLINE INTELLIGENCE
India’s Inflation Shock: CPI and WPI Rise, Markets and Rupee Rebound
September consumer inflation reached 5.54% and wholesale inflation 11.39% as the rupee and Indian technology shares staged a rebound. The issue connects higher energy costs, imported inflation, currency policy, equities and company earnings.

Nifty 23,146.15 | Sensex 74,729.27 | USD/INR 94.96 | Brent $109.86/bbl | FX reserves $726.03bn (week ended 9 October)
01 | Executive Intelligence Brief
September CPI rose to 5.54% and wholesale inflation to 11.39%, even as the Nifty gained 2.8%, Sensex 3.1%, and rupee recovered to 94.96/USD. Food costs and energy-driven producer inflation challenge the durability of market relief.
The issue’s six principal signals point in different directions. September food CPI rose 7.74%, while wholesale fuel and power inflation reached 25.85%. By contrast, India’s technology-led equity recovery took the Nifty 50 up 2.8% and the Sensex up 3.1% over the week. Importers gained some rupee relief, but expensive crude continued to threaten landed costs. [S1][S2][S4][S5][S6]
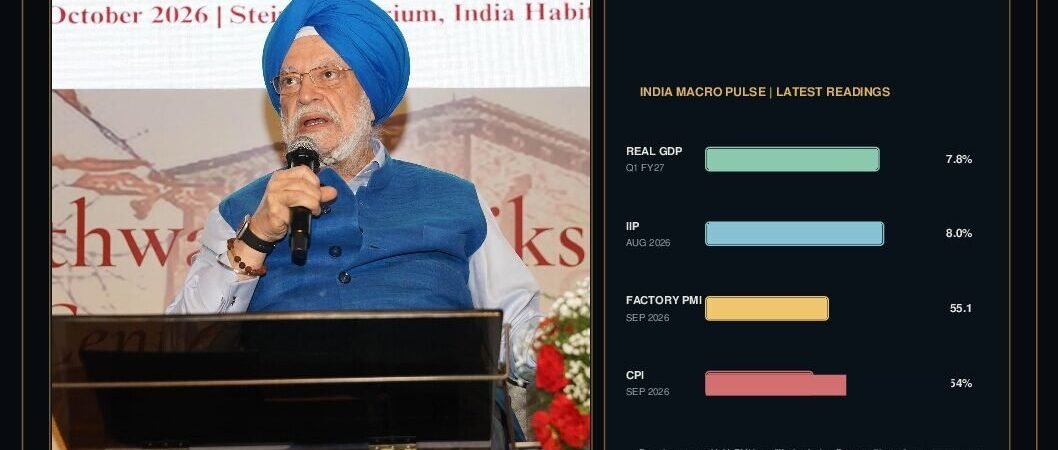
The distinction matters for policy and earnings. An improving equity index cannot establish that household spending power or producer margins have recovered. Durable relief requires moderating imported inflation, less strained domestic funding and stronger conversion of corporate revenues into cash. Meanwhile, real GDP grew 7.8% in Q1 FY27, August industrial output advanced 8.0% and September manufacturing PMI stood at 55.1. These are activity readings, not substitutes for inflation measures. [S10][S11][S22]
Follow the series through Issue 005 and the Indian Economy & Markets Compass archive. Subscribe for forthcoming weekly editions via the ALBORITHM subscription page.
02 | Headline Analysis: Prices Versus Market Relief
September food inflation of 7.74% and fuel and power WPI of 25.85% show that households and companies face a cost shock. Strong IT earnings and a rebound in equities do not automatically cancel that shock.
Consumer and wholesale price indexes are not two readings of an identical basket. Retail inflation captures prices households pay; wholesale inflation reflects a separate set of transactions. Their simultaneous rise widens concern over cost transmission, especially when the crude benchmark is near $110 a barrel. Higher energy, insurance and freight costs reach companies through different routes and at different speeds. [S1][S2][S6]
The countervailing evidence is an IT-led market rebound. Better earnings and risk appetite strengthened the indexes without settling questions about domestic consumption, corporate finance or imported energy costs. A broader improvement would require falling inflation breadth, stabilized foreign capital flows and more predictable delivered crude costs. A new oil disruption, weaker food supply or tighter bank funding would instead complicate the outlook.
The policy channel also matters. The RBI raised its repo rate to 5.50% on 7 October and subsequently changed foreign-exchange market rules. The rupee recovered to 94.96 per dollar by the 16 October close. Currency support does not remove the physical need to import oil or meet foreign-currency invoices. [S5][S12][S16]
03 | Markets & Macro Dashboard
On 16 October Nifty 50 closed at 23,146.15, Sensex at 74,729.27, rupee at 94.96/USD and Brent at $109.86/bbl. FX reserves were $726.03 billion for the week ended 9 October. Merchandise deficit was $30.21 billion in September.
India’s September merchandise exports were $44.40 billion and imports $74.61 billion, leaving a goods deficit of $30.21 billion. The gap widened compared with August but narrowed against September 2025. A currency rebound can change the rupee cost of trade, but not the underlying dollar-denominated flow. [S3]
Reserve data require the same date discipline. The $726.03 billion foreign-exchange reserve stock was measured for the week ending 9 October and declined $8.58 billion from the previous week. The change is not a pure intervention estimate because valuation and transactions also influence the reported total. [S7]
Evidence distinction: The Nifty, Sensex and rupee values are Friday 16 October closes; Brent is a separately timed futures settlement. All are historical market observations. The reserve stock and economic releases have their own observation dates, so none should be interpreted as a single live Sunday snapshot.
Market data at a glance
| INDICATOR | VALUE | OBSERVATION | INTERPRETATION |
|---|---|---|---|
| NIFTY 50 | 23,146.15 | 16 OCT CLOSE | +2.8% WEEK |
| SENSEX | 74,729.27 | 16 OCT CLOSE | +3.1% WEEK |
| USD / INR | 94.96 | 16 OCT CLOSE | RUPEE RECOVERY |
| BRENT | $109.86 | 16 OCT SETTLE | ENERGY RISK |
| FX RESERVES | $726.03bn | W/E 9 OCT | LAGGED STOCK |
| CPI | 5.54% | SEP 2026 | FOOD 7.74% |
| WPI | 11.39% | SEP 2026 | FUEL 25.85% |
| GOODS DEFICIT | $30.21bn | SEP 2026 | WIDER MoM |
04 | Global Economy & Geopolitics
Global oil price, freight, insurance and currency funding determine India’s delivered crude cost. September merchandise exports reached $44.40 billion, imports $74.61 billion, and deficit $30.21 billion. India’s petroleum minister discussed energy diversification in New Delhi on 16 October.
India’s vulnerability involves more than headline benchmark crude. Freight, marine insurance, shipping access, crude grades and dollar financing contribute to landed energy cost. The difference between securing a supply agreement and realizing a lower import bill can be substantial when transport or insurance remains expensive. [S6]
At the 16 October energy-security conclave in New Delhi, the petroleum minister discussed supplier diversification and safeguarding fuel availability. The report is a factual description of supply-continuity efforts, not evidence that India has escaped international price exposure. The accompanying photograph is from the Press Information Bureau’s dated event record. [S17][S18][S19]
The alternative case is that more reliable physical flows, calmer shipping markets and stronger exports could reduce the shock. That possibility requires confirmation in trade data, delivered energy prices, retail inflation and corporate cash flow. The September deficit is a reminder that improving export growth and a significant import bill can coexist. [S3]
05 | India Macro & Liquidity Radar
The RBI repo remained 5.50%. FX-market measures supported the rupee, although expensive crude and domestic funding conditions still matter. October MPC minutes are scheduled for 21 October.
The repo rate is only one part of the financial environment. Treasury-bill funding costs, system liquidity, foreign-exchange access and government-bond supply can tighten conditions even when the official policy rate is unchanged during a given week. The RBI’s calibrated tightening and subsequent dollar-market rules operate through different transmission mechanisms. [S9][S12][S16]
Foreign-exchange reserves of $726.03 billion for the week ended 9 October remain an important buffer, but their weekly movement must not be equated automatically with spot-dollar sales. The rupee’s weekly recovery should also be assessed alongside importer requirements and the international dollar backdrop. [S5][S7]
September CPI at 5.54% and WPI at 11.39% sharpen the questions for the 21 October MPC minutes. The minutes, when released, should be judged for discussion of inflation persistence, growth resilience and financing conditions, rather than assumed to confirm a particular future rate decision. [S1][S2][S12]
06 | Rules, Policy & Release Calendar
The NSE calendar identifies 20 October as a holiday. The October MPC minutes are scheduled for 21 October. Quarterly company results and weekly FX and energy data will provide further tests.
For publication discipline, a scheduled event must remain distinct from a confirmed outcome. The 20 October NSE holiday is a trading-calendar item, not a macroeconomic release. MPC minutes were scheduled for 21 October as of the issue cutoff and should not be described as published in this 18 October edition. [S12][S13]
The additional watchpoints are company Q2 filings, dated rupee and oil closes, money-market rates and delivered import costs. Company results are especially useful when they separate signed orders, realized revenues, operating margins and cash conversion. This distinction prevents headline bookings from being mistaken for already recognized sales.
Readers can compare the prior editorial framework in Issue 005 and review the Indian Economy & Markets Compass archive for continuity across editions.
07 | Research & Data Brief
Q1 FY27 real GDP grew 7.8%; August industrial production grew 8.0%, and September manufacturing PMI was 55.1. These measures describe different aspects of economic activity. Reserve data are lagged and affected by both transactions and valuation.
The September inflation acceleration contrasts with a firm recent output buffer. August manufacturing output growth exceeded aggregate industrial production, while the factory PMI indicated expansion. PMI is a diffusion index, not a measured percentage rate of industrial output growth; real GDP measures yet another aspect of activity. Their differences matter when judging household demand and the quality of growth. [S10][S11][S22]
September merchandise exports rose to $44.40 billion and imports to $74.61 billion. The stronger export performance did not prevent a sizeable trade deficit. Likewise, a fall in the reported reserve stock is not enough to quantify central-bank intervention without separating valuation effects. [S3][S7]
The correct evidence ladder is to use official statistical releases for inflation, output and trade; issuer filings for company earnings; and date-stamped market sources for prices. Interpretation and possible future transmission should remain labelled as analysis, not observations. [S1][S2][S3][S8]
08 | Company Research Lab: HCLTech and Banks
HCLTech’s earnings provide evidence on international technology demand, margins and bookings. HDFC Bank’s quarterly results provide a financial-sector lens on funding, credit profitability and asset quality.
HCLTech reported Q2 FY27 revenue of Rs 35,620 crore, up 11.5% year on year, and dollar revenue of $3.724 billion. Constant-currency revenue growth was 2.6% year on year. Net income reached Rs 5,132 crore, an increase of 21.2%, while EBIT margin was 18.2%. The margin and underlying client demand are a more informative pair than a single headline growth rate. [S8]
The company reported new deal wins with total contract value of $3.258 billion and quarterly advanced AI revenue of $219 million. Bookings are future contractual opportunities, not guaranteed revenue in the quarter in which they are signed. The analytical test is how clients’ budgets and deal implementation convert into profitable, cash-generating services business. [S8]
Banking earnings provide a different transmission lens. HDFC Bank’s results invite review of deposit funding, asset quality, credit costs and treasury conditions. Higher benchmark rates and tight short-term money markets need not affect lenders and borrowers uniformly. These company examples are evidence for sector analysis, not price targets or personal buy-and-sell instructions. [S14][S21]
09 | Global-to-India Transmission
Global energy costs affect the import bill, inflation, rupee demand, credit funding and corporate valuations. Exchange-rate relief does not guarantee lower landed import costs or stronger real earnings.
A stronger rupee can help an importer, but its benefit may be offset by higher dollar oil prices, freight or insurance. An exporter can gain or lose through currency translation while client demand is moving independently. The effect varies with import intensity, hedges, debt maturities, pricing power and working-capital needs. [S5][S6]
Company reporting makes the distinction concrete. Strong HCLTech bookings and margins support a constructive operational interpretation, yet execution costs and cash realization must still be verified. Bank earnings reveal another dimension: the cost of funds may respond differently from official rates and foreign-exchange measures. [S8][S14]
The central transmission chain runs from physical energy supply through the import bill and inflation to financing costs, earnings and valuations. Healthy factory activity is useful insulation, but it is not proof that margins or real household purchasing power are stable.
10 | Signals, Risks & Scenario Matrix
The issue assigns editorial monitoring weights of 45% to partial market recovery, 35% to broader cost pressure, and 20% to relief from energy, funding and cash conversion. These are editorial attention weights, not statistical probabilities.
In the monitoring case, markets retain part of their recovery even as inflation stays elevated. Improvement in earnings breadth, a steadier rupee and manageable goods deficits are confirming signals. Deteriorating cash flow, another energy disruption or renewed currency pressure would undermine that case.
In the adverse case, high landed energy costs and sustained food-price pressure spread into household spending and company margins. The tests are widening retail inflation, WPI pass-through, weaker sales volumes and rising bill yields. Broad disinflation with better cash generation would weaken the adverse reading.
In the relief case, smoother oil deliveries, steadier currency flows and lower food inflation improve real spending capacity. Evidence would include reduced import costs, improved foreign-exchange liquidity and earnings resilience beyond a small number of large companies. All three weights organize editorial monitoring attention; they are not a probabilistic model.
11 | Continuity, Revisions & Forward Intelligence
Compared with Issue 005, September inflation intensified while Indian equities and the rupee rebounded. FX reserves declined and the goods trade deficit widened from August. Track oil, MPC minutes and earnings breadth to judge persistence.
The comparison is sharper than a simple good-week-versus-bad-week narrative. Issue 005 recorded an RBI policy tightening and early recovery in equities. Issue 006 adds published September CPI and WPI inflation, updated trade and reserve readings, a more pronounced IT-led rally and a stronger rupee. Each new observation changes a different part of the macro picture. [S1][S2][S3][S4][S5][S7]
Monitoring should therefore be hypothesis driven: whether oil delivered costs stabilize; whether food inflation remains broad; whether the rate and bill markets transmit tighter conditions; and whether technology bookings turn into cash-generating revenue. Neither the market rally nor the price shock alone answers these questions.
Week ahead: scheduled events
- 20 October: NSE trading holiday; account for the altered trading calendar.
- 21 October: MPC minutes; assess inflation risks and the monetary policy rationale.
- Quarterly earnings: Monitor orders, margins and cash conversion in company disclosures.
- Weekly monitoring: Review dated oil, rupee and market-funding observations.
12 | ALBORITHM Bottom Line
Durable normalization will require simultaneous improvement in imported energy costs, household inflation, external balance, financing conditions and operating cash generation.
The strongest near-term reading is conditional rather than directional. Domestic activity offers a buffer, but elevated energy and food costs are challenging households and producers while financing remains restrictive. The equity recovery demonstrates that investors can reward earnings strength even in an uncomfortable macro backdrop.
The most useful judgment will come from the interaction of actual landed fuel costs, inflation breadth, money-market funding, trade balance and operating cash flow. These are the variables that can either turn a brief relief rally into a sustained improvement or reveal that the recovery is narrow.
Sources, Credits & Evidence
Sources are indexed using the same [S1] to [S22] labels as the official 12-page Issue 006 PDF. Selected primary and contemporary references are linked below; the complete dated source register remains in the original PDF.
- [S1] MoSPI / PIB | September consumer price inflation
- [S2] Reuters | September wholesale inflation
- [S3] Ministry of Commerce / PIB | Merchandise trade
- [S4] Reuters | Indian equity closes, 16 October
- [S5] Reuters | Rupee market close, 16 October
- [S8] HCLTech | Official quarterly earnings
- [S10] MoSPI / PIB | Industrial production
- [S12] RBI policy | October 2026
- [S13] NSE | Exchange holiday calendar
- [S14] HDFC Bank | Financial results
- [S17] PIB | Energy security remarks
- [S18-S19] PIB | Official photo album
Photographs: Press Information Bureau, 16 October 2026, photo identifiers 218305 and 218304. Market values are historical closes or dated releases, not live prices. Interpretation and editorial monitoring weights are distinguished from confirmed observations.
WATCH & LISTEN TO THIS ISSUE
Browse this publication’s video and audio programme. Unreleased Issue 006 media are clearly marked.
For information and education only. Not personalized investment advice. Research cutoff: 18 October 2026, 23:00 IST. All observations retain their source dates.
Subscribe to alborithm
Get new documentaries, articles and podcasts directly in your inbox.