
ALBORITHM | ECONOMICS & FINANCE
The architecture of wealth connects ancient resources and empires with the trade routes, banks and institutions that determine who controls economic power today.
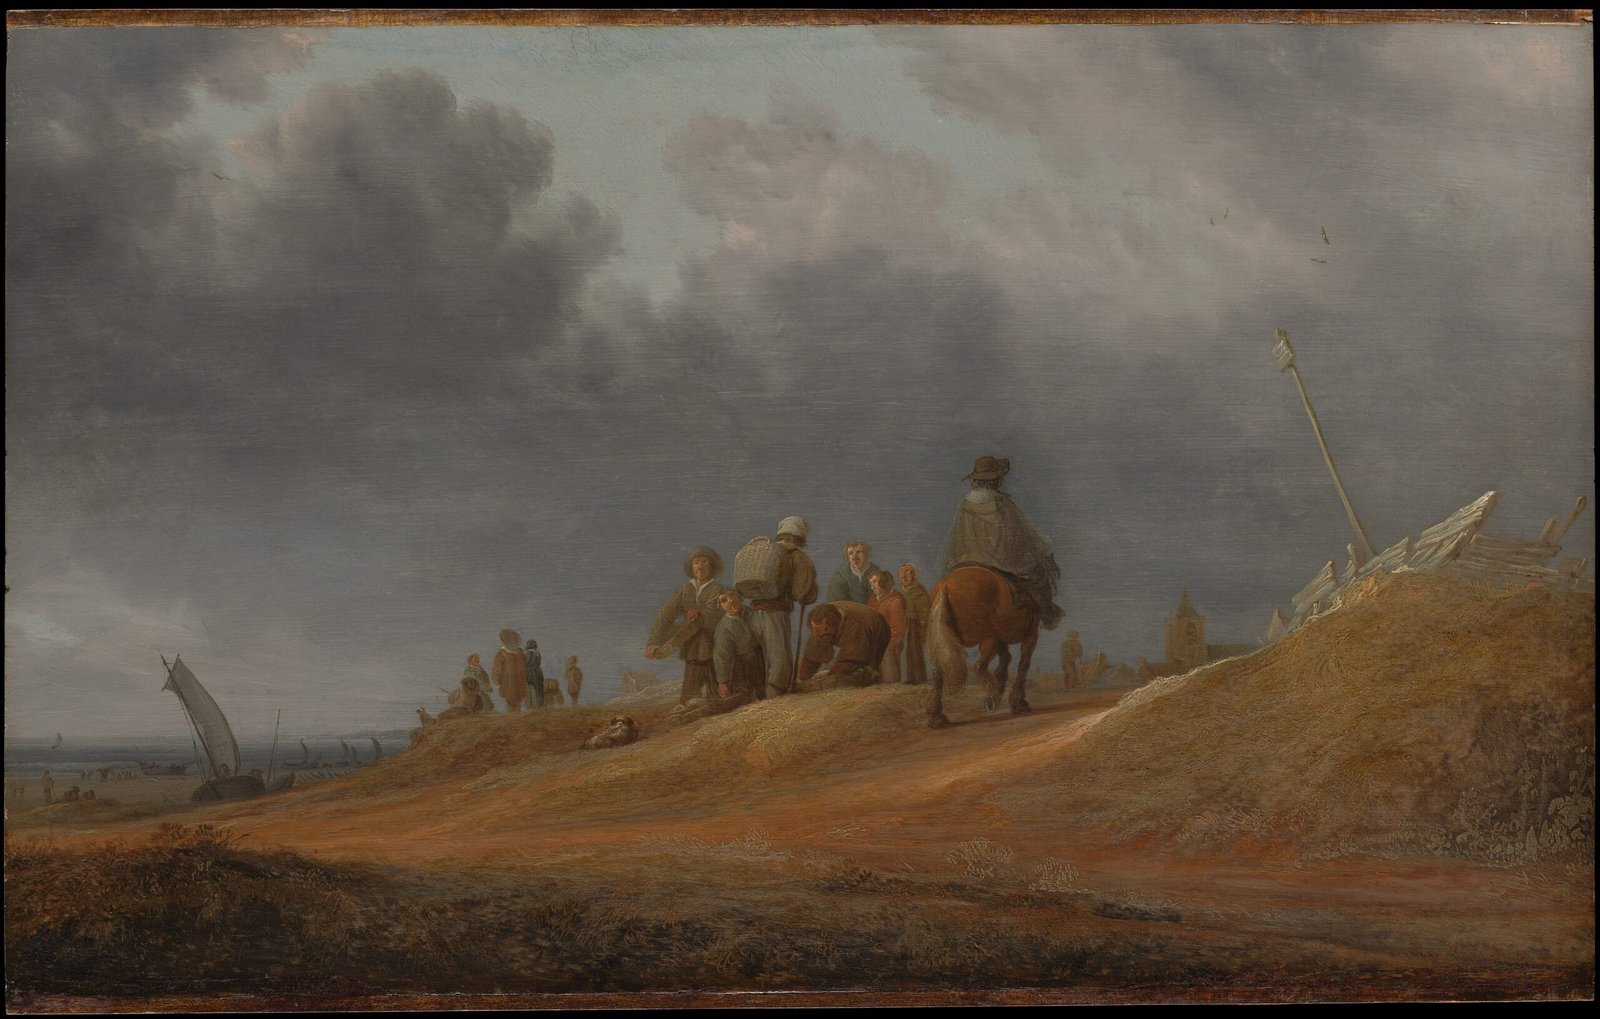 ALBORITHM | VISUAL HISTORYHISTORIC COMMERCE
 ANCIENT TRANSPORT
 GLOBAL COMMERCE
From Mesopotamian grain accounts to modern capital markets, this is a global history of the institutions that decide who produces wealth, who owns it and what survives for the generations that follow.
In this article
- Watch & Listen
- Before money there was wealth
- The granary and the tax collector
- Wealth outside the treasury
- Trade across Africa and Asia
- Conquest and the redistribution of the world
- How one shipment of silver could change three continents
- The company and the creditor
- Industry changed the scale of wealth
- War and competing systems of ownership
- The architecture of wealth in modern finance
- Oil, offshore dollars and the second life of a trade payment
- The physical economy beneath the financial one
- The financial journey behind a cargo ship
- Who administers wealth today
- The institutions that set the terms of wealth
- How wealth is distributed and inherited
- Where the world’s wealth is held
- Where international investment actually lands
- Digital assets and the limits of the balance sheet
- The moments when the architecture breaks
- Conclusion: The claim and the real thing
On an average trading day in April 2025, foreign-exchange transactions worldwide reached about $9.5 trillion. This was not $9.5 trillion of new factories, food or technology. Much of it was the buying, selling and hedging of financial claims. The contrast exposes a question that has accompanied wealth since the first granaries: what is being created, and who holds the right to its returns?
Watch & Listen
One investigation. Four ways to explore the story.
Research-based video and discussions. Podcasts are not verbatim readings.
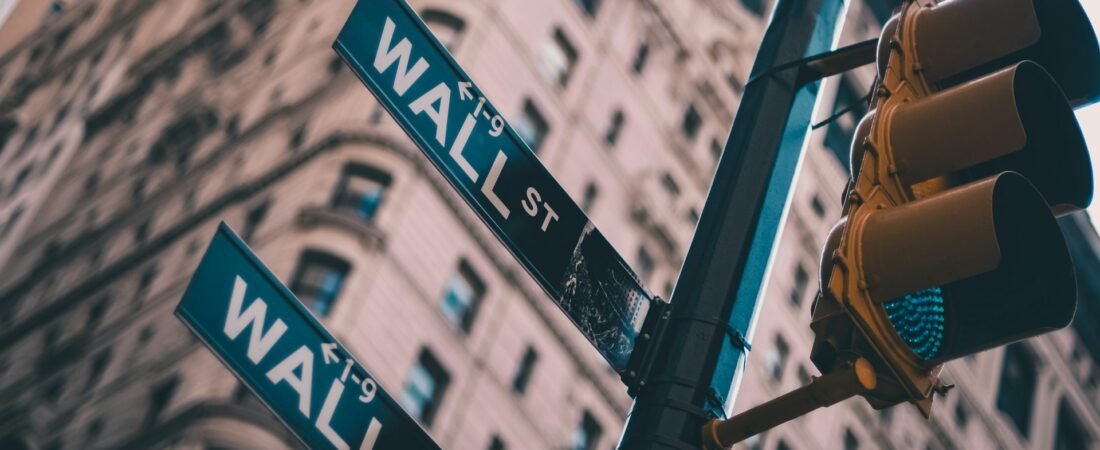
Wall Street is one influential setting for that story, but it is not where most of the goods, skills and resources underpinning modern wealth are produced. A cargo ship, a school, a farm, a power grid and a laboratory can all create economic value far from the financial centres that trade claims over them. The physical networks carrying those goods and resources are explored further in The Architecture of Global Trade. Before examining those centres, return to the earliest surviving accounts of surplus.
A small clay tablet in the Metropolitan Museum of Art carries an account from southern Mesopotamia, probably Uruk, made around 3100 to 2900 BCE. Its signs most likely record the delivery and distribution of barley and emmer wheat. The exact transaction is difficult to reconstruct. What survives is evidence of people keeping track of resources that mattered enough to measure, allocate and remember.1
There is something familiar about it. A warehouse inventory, a land register and a pension statement answer related questions. What exists? Who may use it? Who is entitled to receive something from it later?
Much of economic history lies inside those questions. Farmers improved the soil. Craftspeople developed skills. Merchants connected distant markets. Rulers collected taxes, protected routes and seized territory. Families accumulated property and passed it on. Over time, accountants, bankers, lawyers and public officials built systems through which wealth could outlive its original owner and travel beyond the place where it was produced.
The connection between production and reward was often unequal. A person could create something valuable without owning it. Another could inherit a claim to income without taking part in its production. Understanding wealth requires following both the work and the claim.
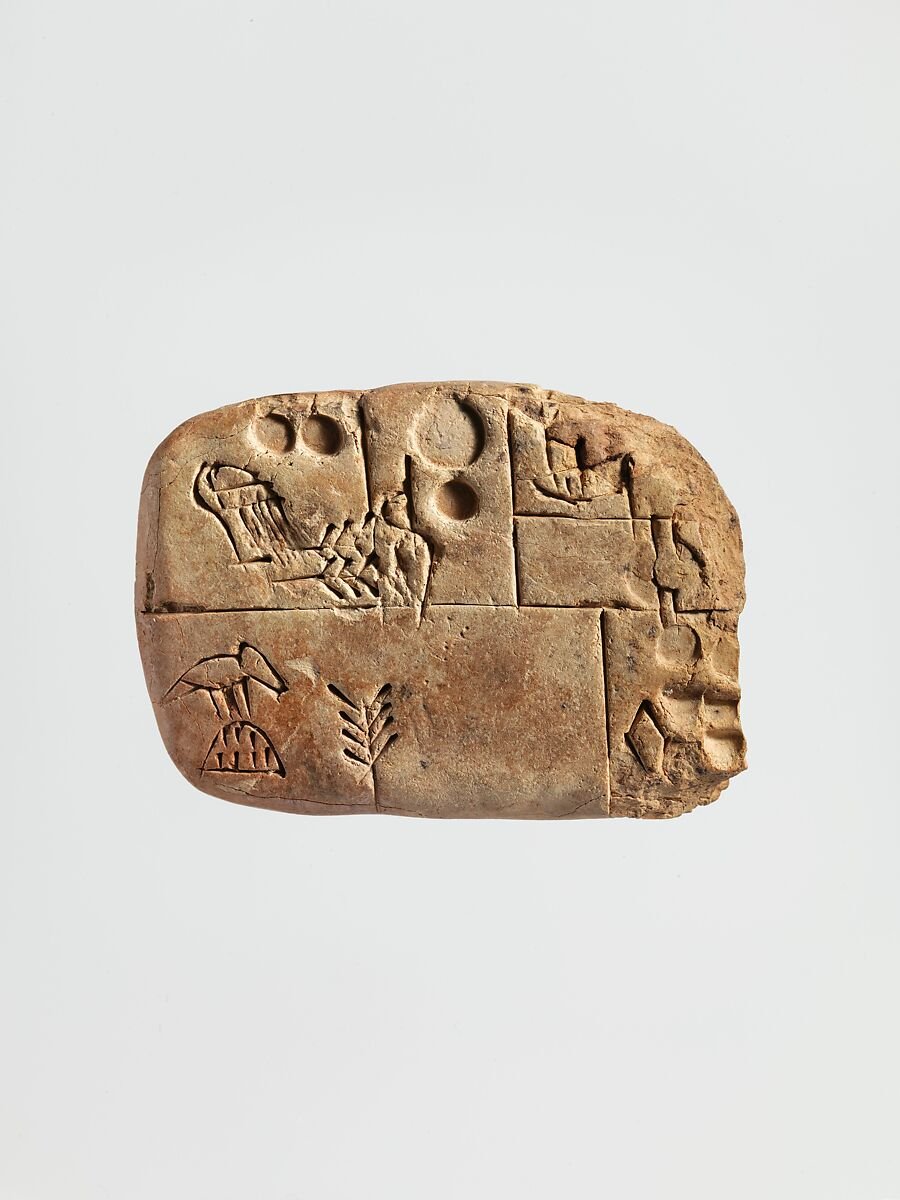
The Metropolitan Museum of Art, object 1988.433.2. Purchase, Raymond and Beverly Sackler Gift, 1988. Public domain and Met Open Access CC0. Collection record.
Resources became wealth when people could preserve them, allocate them and establish claims over their future use.
Before money there was wealth
A fishing ground, a reliable spring, a well-made tool and the knowledge of when to sow could all sustain a community before anyone minted a coin. Wealth, understood broadly, consists of the resources and capabilities that support life and future production. Money provides a means of payment, a unit of account and a store of purchasing power. It is one part of this larger picture.
Modern measurement makes several distinctions. A household’s net wealth is the value of its assets less its debts. Income is what it receives over a period. National accounts measure production through GDP, while the World Bank’s comprehensive wealth framework also considers produced assets, natural resources, human capabilities and net foreign assets. These measures describe different things and should not be added together indiscriminately.2
A house can rise in market value without gaining a room. Its owner becomes wealthier on paper, but the community has no additional housing. A new water system, by contrast, can improve health and productive capacity even when its benefits are imperfectly reflected in private asset prices. An oilfield can produce a stream of income while the resource beneath it is being exhausted.
The earliest economic gains came through accumulated practical knowledge. Better tools, food preservation, cooperation and the management of plants and animals made resources more dependable. Farming, which developed independently in several parts of the world, greatly expanded the possibilities for storing output and supporting people beyond the immediate circle of food producers.
Yet agriculture did not produce a single social order. Archaeological comparisons show substantial variation in inequality. Researchers sometimes use differences in house size as a proxy for differences in wealth, a useful but incomplete measure. Land, livestock, tools, access to labour and political arrangements could produce different outcomes even among farming societies.3
Surplus created choices. Grain could feed people through a poor season, support specialists, supply a public work or sustain an army. It could also be appropriated. Once resources were stored in a fixed place, the ability to guard the store and decide who received its contents became a source of power.
That tension remained. Saving made societies more secure, but control over what had been saved could make individuals more dependent.
FIVE MILLENNIA OF WEALTH
A schematic history of the institutions that assign claims to resources
The granary and the tax collector
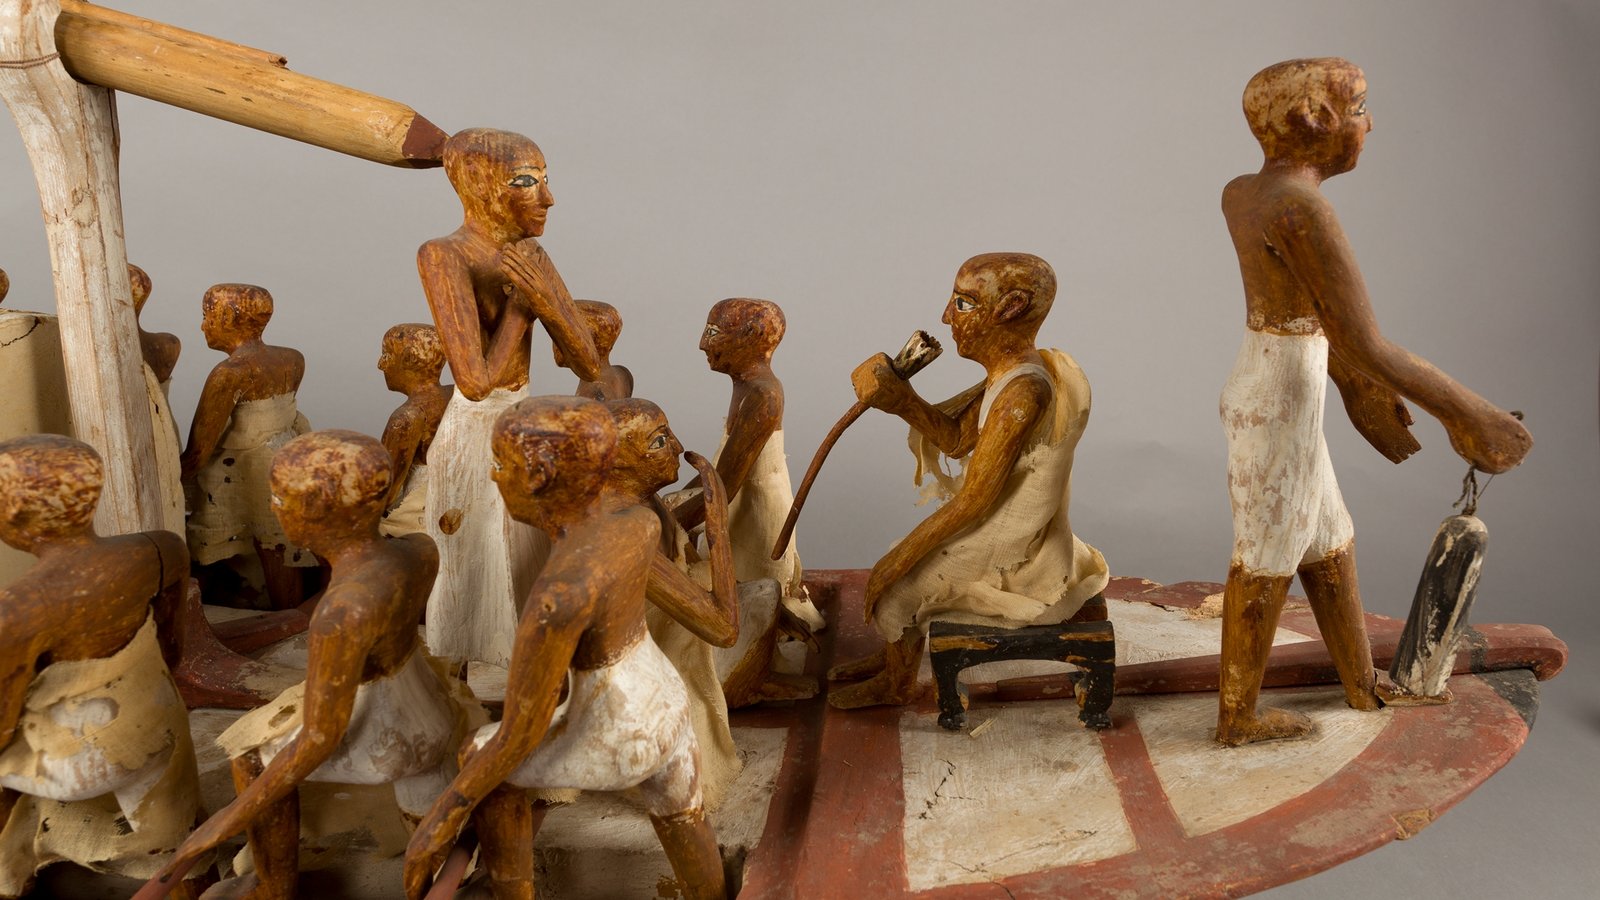
An Egyptian model from the tomb of the official Meketre, dating to about 1981 to 1975 BCE, makes administration visible. Inside a miniature granary, men carry sacks while others measure and record the grain. The museum identifies six carriers and nine men involved in measuring and accounting. Even in a funerary model, production and paperwork occupy different spaces.4
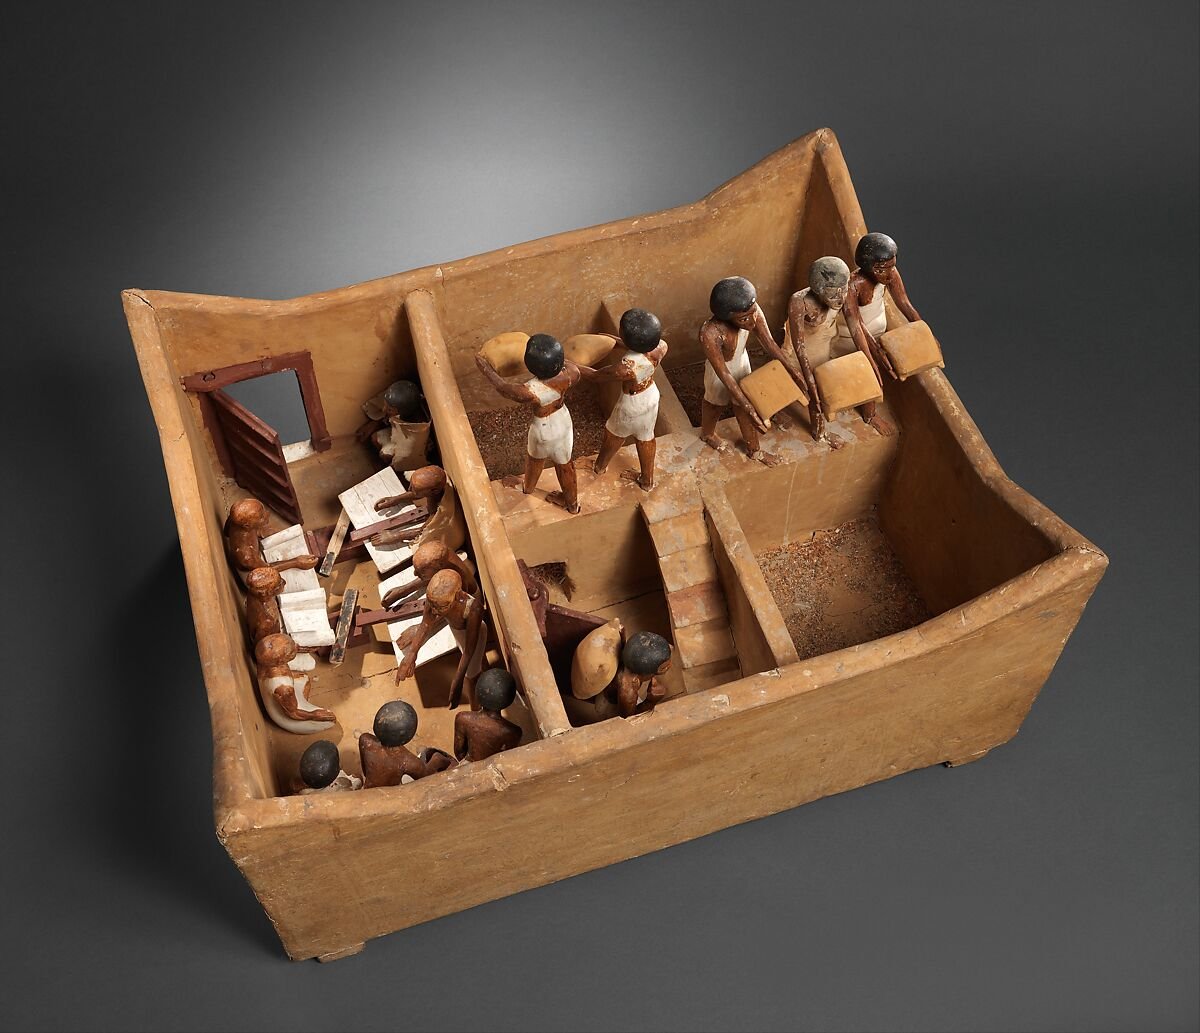
The Metropolitan Museum of Art, object 20.3.11. Rogers Fund and Edward S. Harkness Gift, 1920. Public domain and Met Open Access CC0. Collection record.
Large institutions needed records because memory and personal familiarity could no longer settle every obligation. A ruler needed to know what could be collected. An estate manager needed to know what remained in storage. Workers needed provisions. The account made claims durable, but it also gave the person keeping it influence over people who could not easily challenge the record.
The evidence does not permit equally detailed accounts of every civilization. Indus cities produced distinctive seals and traded with Mesopotamia, but their script remains undeciphered. Their material achievements are clear; the precise organisation of ownership and government is much harder to establish. A surviving monument or valuable object cannot, on its own, tell us how an entire society distributed wealth.5
Land was central because it yielded recurring harvests. Control over water, animals and labour determined how much that land could produce. Ownership itself could be layered. Cultivators might possess customary rights, a local authority might collect dues, and a ruler might demand a further share. Applying a modern freehold title to every ancient or medieval arrangement would obscure these relationships.
Rome combined a predominantly agricultural economy with cities, commerce and a vast imperial administration. Small cultivators, tenants, great estates and enslaved labour all formed part of its economic world. Roads, shipping and political integration helped goods move, while conquest and coercion placed resources at the disposal of the state and privileged owners.6
Revenue systems became elaborate elsewhere too. In Mughal India, agricultural production supported the imperial establishment. Revenue assessment involved information about cultivation, crops and local conditions. Zamindars held varying rights and powers, while officials sought to translate the harvest into an assessable claim. The distinction between the amount assessed and the amount actually collected mattered greatly.7
The common problem was practical. A government needed enough revenue to sustain itself, but excessive extraction could damage the people and production on which its future revenues depended. Assessments could be negotiated, evaded or resisted. Officials had incentives of their own, and instructions issued at court did not necessarily describe conditions in a village.
Taxation could finance irrigation, roads, defence and relief. It could also finance courtly consumption and destructive wars. The existence of a capable treasury tells us that a state could mobilise resources. It does not, by itself, tell us how fairly those resources were raised or how well they were used.
Coinage made some transactions easier to standardise. During the first millennium BCE, distinct coinage traditions developed in western Asia, India and China. Issued pieces reduced some of the uncertainty involved in weighing and recognising metal, and they could serve trade, military payments and taxation.8 They coexisted with payments in goods and with credit. The familiar progression from barter to coins to banking compresses a much less orderly history.
Wealth outside the treasury
Neither kings nor individual property owners accounted for every form of economic organisation. Families, villages, religious institutions and occupational associations held assets and enforced obligations. Access could depend on membership, custom or service rather than a purchase contract.
The Inca state offers a particularly useful comparison. Its roads supported the movement of goods, information and labour across the Andes. Officials used knotted cord records, known as khipus or quipus, to keep information about people and resources. Labour obligations helped maintain the state’s infrastructure and provisioning. An extensive administrative economy could therefore operate without relying on a European-style system of coinage and markets.9
This was no proof of equality. Redistribution could sustain communities and armies while also reinforcing hierarchy. The point is that money was only one of the instruments through which people organised production and compelled contributions.
Shared resources also had their own rules. A pasture might be open to certain households but closed to outsiders. Irrigation water could be allocated by a schedule. A community might regulate fishing or timber cutting. Elinor Ostrom’s research later demonstrated that users could, under particular conditions, develop effective arrangements for governing common resources.10
Such systems should not be romanticised. Membership could exclude migrants, subordinate groups or women. Local authority could be coercive. Nevertheless, the historical choice was broader than an unregulated market on one side and a central ruler on the other.
Religious endowments supplied another way to make an asset endure beyond one lifetime. Across different traditions, land and buildings supported worship, learning, care and the distribution of food. The arrangements varied, but their economic logic was recognisable: preserve an income-producing asset and assign its proceeds to a continuing purpose.
Waqf endowments in Islamic societies, for example, supported schools, hospitals and other services through dedicated property and its income.11 These institutions connected private generosity with continuing administration, including difficult questions about who supervised the asset and whether its intended beneficiaries actually received support.
Inheritance performed a similar act for families. It connected one generation’s accumulated advantage to the next. The right to inherit, and the freedom to manage what was inherited, depended on legal status and local rules. Marriage and kinship therefore belonged to the history of wealth as much as markets did.
Markets were connected before there was one world economy
A conceptual network of long-distance commercial regions. This is not a geographic map, a single route or a claim that every connection existed simultaneously.
Trade across Africa and Asia
Long before European overseas empires, wealth moved through extensive African and Asian networks. The routes connected places with different resources, skills and needs, creating opportunities for people who could organise transport, establish trust or control a crossing.
West African gold entered trans-Saharan commerce and helped meet demand for coinage in North Africa and the Mediterranean. The kingdoms of Ghana and Mali occupied important positions in these networks. Mines mattered, but so did the ability to secure routes, supply caravans, regulate access and participate in exchange.12
Across Eurasia, the Silk Roads consisted of shifting routes and successive intermediaries. A bale of cloth might pass through several hands without its original producer ever meeting its final buyer. These networks carried knowledge, techniques and beliefs along with merchandise.13
China’s silk exports were already significant under the Han dynasty. The value lay partly in the material and partly in the skill required to produce it. Knowledge of sericulture eventually spread beyond China, changing the geography of production.13 The struggle to retain the benefits of specialised knowledge has a much longer history than the modern patent.
The Indian Ocean had its own rhythms. Seasonal winds helped connect East Africa, the Arabian coast, the Indian subcontinent, Southeast Asia and China. Merchant communities organised trade across jurisdictions and languages. Indian textiles were particularly important: the V&A documents exports to markets across Asia, Africa, the Middle East and the Mediterranean well before Europeans established their oceanic trading companies.14
Distance created a financing problem. Producers often needed payment before merchants could sell the goods. Voyages took time, outcomes were uncertain and carrying metal was expensive. Credit made these chains possible by placing obligations between the stages of production and sale.
In India, hundis served several commercial purposes, including remittance and credit. Their use depended on networks of bankers and merchants who recognised the instrument and trusted, or could enforce, the obligation behind it.15 In Islamic commercial traditions, partnerships such as qirad or mudaraba allowed one party to supply capital and another to conduct an enterprise, sharing profits under agreed terms.16
These practices rewarded financial expertise, but they did not eliminate risk. Reputation could fail. A debtor could disappear. A ruler could confiscate property. Commercial institutions worked because people combined personal connections with rules, records and methods of resolving disputes.
China developed a different response to the burden of physical currency. Merchant receipts preceded government-issued paper money under the Song in the eleventh century. Paper reduced the difficulty of transporting large amounts of coin, but it made the credibility of the issuer more important.17

Photograph by BabelStone, Wikimedia Commons. CC0 1.0. Collection record.
The financial innovations of this period emerged in several regions. Later European banking drew its strength from a long history of attempts to coordinate exchange over distance. No single civilization invented the entire system.
Empires, merchants and investors connected distant production to distant ownership, often under unequal terms.
Conquest and the redistribution of the world
European expansion from the late fifteenth century connected existing commercial worlds more tightly while subjecting many of them to new forms of violence. Territorial conquest changed who could collect revenue, command labour and claim resources. The gains recorded by an imperial treasury could coincide with catastrophic losses for the people brought under its control.
American silver became part of a global circuit. Mines in Spanish America supplied metal that travelled through Atlantic trade and across the Pacific. The Manila galleons exchanged New World silver for Asian goods, including silk and porcelain. Chinese demand helped draw silver eastward.18
The metal had to be extracted before it could circulate. Potosi’s mining complex depended heavily on Indigenous labour, including compulsory labour under Spanish colonial rule. Its celebrated output cannot be separated from the conditions under which people worked and the burdens imposed on surrounding communities.19
Plantation wealth rested on another system of coercion. Enslaved Africans and their descendants produced sugar, tobacco, cotton and other commodities for international markets. Merchants, lenders, insurers and processors participated in the commercial networks surrounding that production. People were treated in law and accounts as property, while being denied authority over their own lives.
The abolition settlement in the British Empire reveals how deeply ownership shaped distribution. The legislation of 1833 provided £20 million in compensation to slave owners. UCL’s research traces these payments and the people who received them. The formerly enslaved received no equivalent compensation under that settlement.20
In South Asia, the East India Company’s acquisition of revenue rights in Bengal, Bihar and Orissa in 1765 marked a major change in its position. A trading organisation gained access to a territorial tax base. Commercial activity, military force and fiscal authority became closely connected.21
It would be misleading to attribute all subsequent European prosperity to a single source. Technical innovation, domestic investment, institutions, education and access to energy also mattered. But treating colonial extraction as incidental would be equally misleading. Conquest redirected land, labour, revenue and trading opportunities, and often constrained the ability of conquered populations to decide how their resources would be used.
The distinction between additional production and a transfer of ownership is essential here. A canal may increase the amount an economy can produce. Seizing an existing field primarily changes who receives its harvest. Both can enlarge an owner’s fortune. Their meaning for the wider society is very different.
How one shipment of silver could change three continents
Follow a shipment of silver leaving the mines of Spanish America. The metal might move through a port, cross an ocean, be used to pay for textiles or ceramics and eventually enter circulation far from its original source. The people involved would not have described every part of the journey as a single market. For them there were separate mines, workshops, merchants, taxes, voyages and debts. Yet prices in one place could alter incentives in another.
The connections were neither frictionless nor equal. Imperial monopolies, coercive labour systems and the risk of maritime loss shaped the distribution of gains. Merchants could earn margins for managing distance and credit. Rulers collected taxes. Mine owners commanded labour and capital. Communities supplying the labour often bore the deepest costs. The UNESCO record for Potosí documents the scale of an extractive urban and hydraulic system, while the Metropolitan Museum’s account of the Manila galleons describes an enduring Pacific trade system.
The crucial transformation was not that wealth suddenly became global in one year. It was that distant producers and holders of claims became increasingly exposed to the same price signals, credit conditions and political decisions. The physical metal moved slowly. The expectation of its arrival could move prices and promises much earlier.
Silver could cross an ocean as cargo. Capital required something different: a transferable claim that could survive a shipwreck, a change of manager or a long wait for repayment. That was one reason the company, the creditor and the organised exchange acquired such importance.
The company and the creditor
Long-distance enterprises required a way to assemble capital and keep it committed. A partnership organised around a single voyage was poorly suited to maintaining fleets, warehouses and overseas establishments over many years.
The Dutch East India Company, chartered in 1602, helped develop a durable corporate form. Transferable shares allowed an investor to sell a claim without necessarily withdrawing resources from the enterprise. Management could continue beyond the participation of any one investor. Research on the company’s early years shows that its arrangements evolved through practical adjustments, rather than arriving as a complete design on the day of incorporation.22

VOC document, Westfries Archief, via Wikimedia Commons. Public domain. Collection record.
This separation of an enterprise from its individual investors proved powerful. It became easier to gather savings from people who would never manage the business themselves. A shareholder could participate in a distant activity through a financial claim.
The colonial companies also possessed privileges and coercive powers that ordinary firms do not. Their development cannot be detached from monopoly rights, armed trade and empire. A useful financial institution could coexist with predatory conduct.
Public borrowing expanded the same principle into government. The Bank of England was founded in 1694 in connection with a £1.2 million loan to the government. Its original loan was secured on specified tax revenues.23 Future collections could help finance present expenditure, provided creditors believed that the state would continue to collect and repay.
This increased a government’s capacity to wage war and fund large undertakings. It also created a constituency with a financial interest in the reliability of public administration. Tax records, parliamentary decisions, debt management and monetary credibility became part of the value of a government obligation.
Credit distributes resources across time. It allows a farmer to sow before the harvest, a business to build before sales arrive and a government to undertake work before all the necessary taxes have been collected. The borrower gains present capacity in exchange for a future obligation.
That exchange can improve prosperity when it finances something useful and affordable. It can also make people vulnerable. A failed harvest, a fall in sales or a change in interest rates can turn an apparently manageable promise into an intolerable burden. The history of finance is therefore also a history of bankruptcy rules, collateral, debt relief and arguments about whose losses should take precedence.
Industry changed the scale of wealth
Industrialisation expanded productive capacity through the interaction of machines, energy, knowledge and investment. Coal and steam enabled work on a scale that human muscle, animal power and local water flows could not readily sustain. Improvements to engines reduced fuel use and widened their application in mills and factories.24
The machines were part of a larger system. Skilled mechanics had to build and maintain them. Suppliers needed reliable orders. Workers had to be recruited. Roads, canals, railways and ports connected production to markets. Inventors and entrepreneurs depended on networks through which useful knowledge could circulate and improvements could be tested.25
Industrial wealth could grow by increasing output per worker. Some gains reached consumers through cheaper goods. Others appeared in profits, wages or the value of land near expanding towns. Their distribution depended on competition, bargaining power, ownership and political decisions.
Workers did not receive the benefits on an equal timetable. Lewis Hine’s photographs of American mills in the early twentieth century document children among the machinery. The images make visible a cost that an output figure or a company balance sheet could leave largely out of view.26
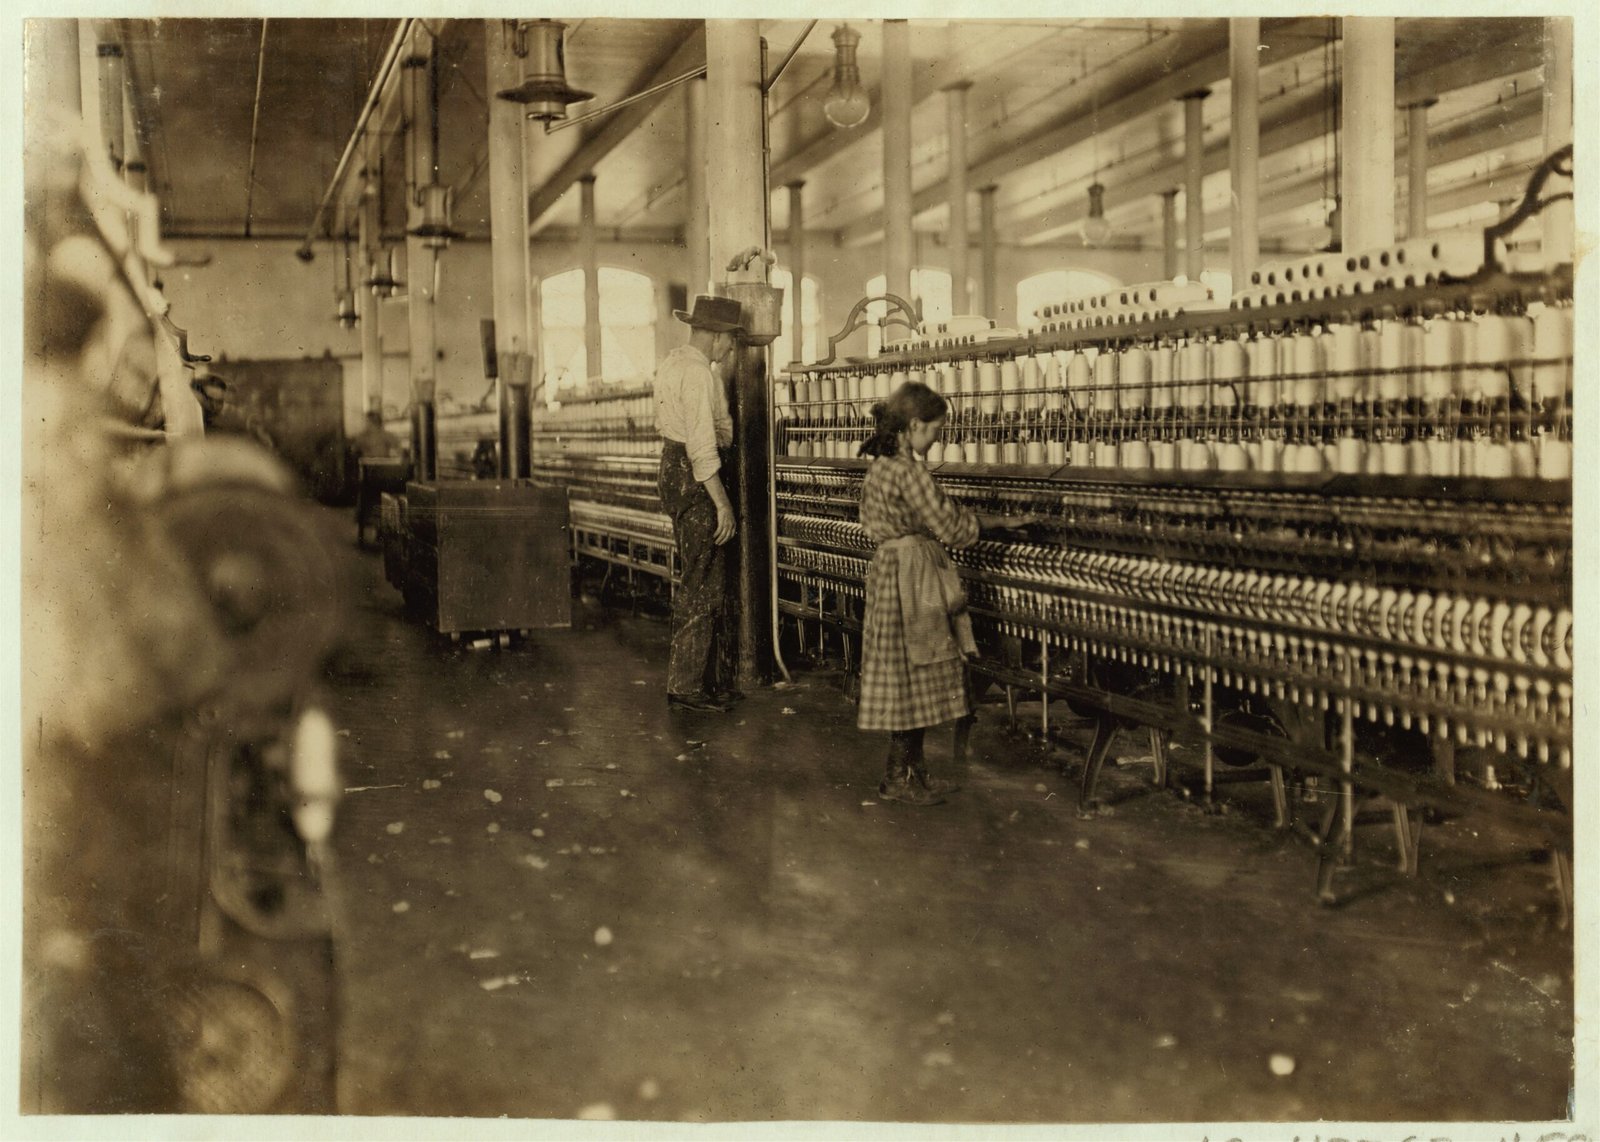
Lewis Wickes Hine, National Child Labor Committee Collection, Library of Congress. Digital identifier cph.3a20279. Public domain; Library of Congress records no known restrictions on publication. Collection record.
The geography of industry changed repeatedly. Manufacturing expanded from Britain into continental Europe and North America, then developed through different institutions in Japan and other parts of Asia. Existing craft industries faced severe competition and, in colonised regions, unequal policy conditions. Indian textiles, for example, encountered both mechanised production and trading rules that favoured British manufacturers.14
Industrial fortunes drew on genuine improvements in production, but monopoly, privileged access and control over essential infrastructure could also produce high returns. Distinguishing an entrepreneur’s reward for creating a useful service from income earned by restricting competition became a central problem of economic policy.
Meanwhile, societies began to organise more extensive protection against the risks of wage dependence. Germany’s late nineteenth-century social insurance programmes and the later development of broader welfare systems turned sickness, injury and old age into matters of collective provision.27
Such arrangements affected wealth formation. A family facing a medical bill could lose years of savings. Insurance and public services could reduce that exposure. Education could broaden access to skilled employment. Secure housing and reliable infrastructure could make it easier to take a business risk. The capacity to accumulate assets depended partly on whether ordinary setbacks consumed everything a household had saved.
Currencies and balance sheets made claims more mobile, and more dependent on institutions that could sustain trust.
War and competing systems of ownership
The twentieth century brought violent disruptions to property and production. War destroyed buildings, infrastructure and lives. Inflation reduced the purchasing power of some financial claims. Revolutions and nationalisations transferred ownership. Taxation and expanding public provision altered the division of income and risk.
Socialist planning sought to place major productive assets under state control and direct investment through public decisions. In the Soviet system, plans specified outputs and inputs, while administrative bargaining helped determine access to resources. This could mobilise production toward state priorities, but it also created persistent problems of information, incentives and accountability.28
Public ownership did not automatically give workers effective control. Decision-making power could remain concentrated in a bureaucracy. Conversely, private ownership could be widely held in legal form while actual authority rested with a small group of managers or controlling shareholders. The identity of the owner and the exercise of power were related, but distinct.
After the Second World War, many countries built mixed economies. Private enterprise operated alongside public infrastructure, social insurance, regulation and state-owned businesses. The balance differed greatly across countries and changed over time.
Decolonisation opened another set of questions. Newly independent states needed to expand capabilities and economic autonomy, often while inheriting narrow export bases and severe infrastructure gaps. Their responses included planning, public investment, development banks, import substitution and, later in many cases, greater reliance on exports and private investment.
East Asian growth demonstrated the importance of combining production for larger markets with investments in human capabilities and effective institutions. The experience was varied, and the contribution of particular industrial policies remains debated. It nevertheless showed that the geography of prosperity could change substantially within a few generations.29
Later privatisations again altered ownership on a large scale. The experience of the former Soviet Union and Eastern Europe showed how much depended on the rules governing the transfer. Where insiders gained valuable assets on favourable terms, a change intended to create markets could also establish a new concentration of private wealth.28
State ownership and private ownership each require scrutiny. Who appoints the decision makers? Who can challenge them? Who receives the returns? Who bears a loss? The label alone cannot answer these questions.
The architecture of wealth in modern finance
In July 1944, representatives of 44 countries met at Bretton Woods to design a more stable international monetary order. The conference laid the foundations for the International Monetary Fund and the International Bank for Reconstruction and Development, the original World Bank institution.30

US National Archives and Records Administration, RG 208 Roll 211, via Wikimedia Commons. Public domain US federal government work. Collection record.
The exchange-rate system that followed centred on the dollar and its official convertibility into gold. The United States suspended that convertibility in 1971. By 1973, major currencies were floating, ending the old arrangement. International commerce continued, increasingly dependent on monetary institutions, financial markets and confidence in currency issuers.31
To understand this world, it helps to follow an ordinary commercial transaction. Consider a manufacturer in India selling equipment to an overseas customer. The manufacturer pays workers and suppliers, arranges transport and may borrow to cover the interval before payment. The buyer acquires a useful asset. Banks handle payment and possibly currency conversion. The shipping company earns freight, and governments collect applicable taxes. The shipping container’s role in making transactions like these economically viable is explored in The Magic Box. This is an illustrative transaction, but its overlapping claims are typical of international business.
The export receipt is revenue, not pure profit. Materials, labour, freight, interest and depreciation all matter. Nor does receiving money mean that an equivalent amount of new wealth has appeared. Some of the transaction pays for resources already used. Some may finance future production. The economic result depends on the whole chain.
Commercial banks add another layer. When a bank makes a loan, it generally creates a matching deposit. It need not first locate an identical pile of money saved by another customer. Lending is nevertheless constrained by credit risk, profitability, funding and liquidity needs, capital requirements and monetary policy.32
The new deposit is accompanied by a debt. Whether the transaction eventually adds to real prosperity depends on what is financed and whether the expected income materialises. Credit can support useful investment, but rising credit and rising asset prices can also reinforce each other without a comparable increase in productive capacity.
Across countries, payments are connected to financial claims. A current-account surplus corresponds, in the balance-of-payments framework and allowing for the capital account, to net lending abroad. A deficit requires net financing. This does not mean that every exporting company buys a foreign bond, or that a country has one coordinated investment plan. Private firms, households, banks and public institutions make many separate decisions.33
Borrowing abroad can fund productive investment. It can also create vulnerabilities when debts mature too quickly or are denominated in a currency the borrower does not earn. Likewise, a surplus does not guarantee good investment of the proceeds. The terms of the claims matter as much as their direction.
Currency composition of official foreign-exchange reserves
Oil, offshore dollars and the second life of a trade payment
Consider an energy-importing country purchasing crude oil. It needs a currency that the supplier will accept. A dollar invoice can therefore create demand for dollar funding even if neither the producer nor the buyer is American. A commercial bank may lend the dollars, the cargo changes hands, and the exporter’s bank receives the payment. The exporter must then decide what to do with its earnings. They can finance imports, stay on deposit, buy bonds, invest abroad or be transferred to a sovereign wealth fund.
That sequence helps explain why commodity trade, international banking and sovereign portfolios are linked. During the oil shocks of the 1970s, large surpluses accumulated in oil-exporting economies and banks intermediated much of that money back to borrowers, including developing countries. Subsequent debt problems demonstrated how easily a surplus in one jurisdiction can become a vulnerability in another when lending maturity, exchange-rate denomination and repayment capacity do not align.
Dollar liabilities also exist beyond the United States through offshore banking and capital markets. This is one reason the international role of the dollar cannot be measured by looking only at Federal Reserve banknotes or at countries that peg their currencies to it. The same currency can dominate invoicing, borrowing, reserve management and FX trading in different degrees.
The distinction matters when claims about a new monetary order are made. The dollar represented 56.70% of reported foreign-exchange reserves in Q2 2026, according to the IMF. The euro accounted for 20.60%, the yen 4.96% and the renminbi 2.11%. The share of dollars was lower than in the previous quarter, but the IMF notes that the overall reserve stock, asset prices and actual portfolio decisions all affect reported shares. Reserve composition is not the same measure as trade invoicing or the currency used for international debt. 44
The physical economy beneath the financial one
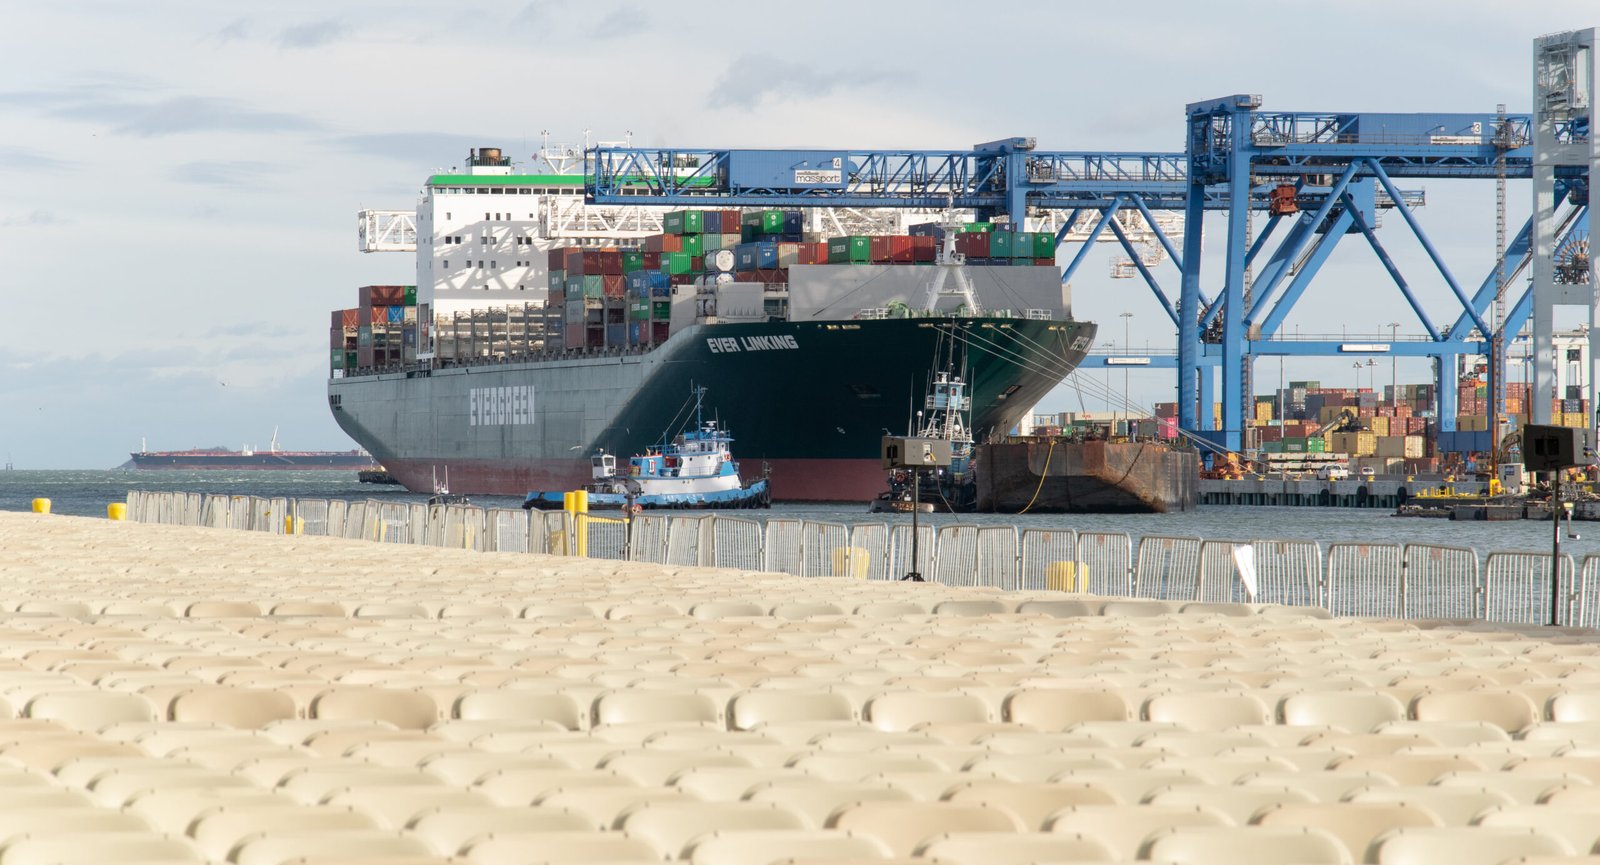
Containerisation, cheaper communication and improved logistics made it easier to divide production among countries. A product could be designed in one place, assembled in another and sold through a distribution network elsewhere. Global value chains created opportunities for economies to participate in particular stages without first building every industry required for a finished product.34

Hummelhummel, Wikimedia Commons. CC BY-SA 3.0. Collection record.
Participation did not guarantee an equal share of the final return. A factory might face intense competition while the owner of a patent, a brand or a distribution platform retained more bargaining power. The location of production, the legal location of the firm and the residence of its ultimate owners could all differ.
A copper deposit offers a useful example. Its value depends on geological quality, extraction costs, access to electricity and water, transport, market demand and the rights granted to the operator. The division of its proceeds also depends on wages, taxes, financing terms, ownership and environmental obligations. A resource can be geographically local while its income travels through several jurisdictions.
Oil exporters and other commodity producers face a related choice. Proceeds can support present consumption, domestic investment or the acquisition of foreign assets. A sovereign wealth fund can convert part of an exhaustible resource into a portfolio intended to generate future income. Whether that benefits citizens depends on the fund’s mandate, governance and the wider management of public finances.
The physical system remains decisive. A payment can cross a network in seconds, but a ship still requires a navigable route and a functioning port. Factories need power. Farms need water. Digital services depend on cables and equipment. The value of a financial claim ultimately depends on the ability to deliver something, produce income or transfer an enforceable right.
This is why disruption can travel far beyond its point of origin. A damaged port delays production. A failed supplier interrupts customers. A lender withdrawing credit can leave a viable company unable to pay its bills. International integration creates useful connections and, at the same time, channels through which shocks spread.
TWO INTERLOCKED CIRCUITS
Goods and services move through production; financial claims move through balance sheets
The financial journey behind a cargo ship
Take an illustrative shipment of manufactured machinery from an exporter in East Asia to a buyer in South Asia. The goods travel on a vessel and a lorry. The payment may travel through an entirely different network. An importer arranges financing with its bank, the exporter’s bank may confirm a letter of credit, and a correspondent bank or payments system handles settlement in the invoicing currency. Insurers cover defined transport and commercial risks. Customs authorities establish duties and release the goods. Each participant operates under contracts and rules that differ from the physical transport contract.
A successful delivery increases inventories or productive equipment at the destination. An amount of money is transferred to the seller or lender. If the exporter retains the payment in foreign financial assets, the merchandise transaction has a financial counterpart. A trade surplus is not a warehouse where surplus currency sits idle. It is reflected, with other balance-of-payments entries, in acquisitions of foreign assets, repayments of liabilities, reserve accumulation or statistical discrepancies.
There are important limits to this analogy. A single shipment may be financed in local currencies, paid in advance or settled through open-account credit without a letter of credit. Bank loans create deposits within monetary systems, but they do not conjure the machinery, labour and energy needed to produce a machine. A transaction’s accounting entries and the economy’s capacity to create real output must be kept distinct.
A TRADE SURPLUS CAN BECOME AN INVESTMENT
Illustrative route; actual balance-of-payments entries are more varied
The global payment network is unusually concentrated. The BIS 2025 survey found average daily FX turnover of about $9.5 trillion in April 2025. Its measure captures trading, hedging and market intermediation, not $9.5 trillion of new goods or services produced each day. Sales desks in the United Kingdom, United States, Singapore and Hong Kong SAR handled roughly three-quarters of reported FX turnover. Control over financial infrastructure therefore matters even when the original good is made and consumed elsewhere. 45
Who administers wealth today
Modern wealth has no single controller. Authority is distributed among institutions with different mandates and unequal influence.
Governments define and enforce property rights, collect taxes, borrow and spend. Courts settle disputes and determine what happens when obligations cannot be met. Public registries make claims to land or companies identifiable. Central banks influence monetary conditions and provide key settlement assets. Their powers are substantial, but they do not amount to ownership of the economy.
Companies place capital under boards and managers. Banks decide which borrowers to finance. Pension funds, insurers and investment funds allocate pools of savings according to their obligations and mandates. An asset manager administering a portfolio for clients does not personally own all the wealth reported as assets under management. Decisions over investment and shareholder voting can nevertheless give such firms considerable influence.
Administration reaches into less visible institutions. Custodians hold assets for clients. Securities depositories maintain records of holdings. Payment and settlement systems complete transfers. Central counterparties stand between parties in some markets and manage the resulting exposures. International standards recognise these systems as critical financial infrastructure.35
Accounting affects what can be seen. An asset valuation is an estimate made under particular rules, not a promise that every owner could sell at that price simultaneously. An audit provides assurance within a defined scope; it cannot remove business risk. A credit rating expresses an assessment of creditworthiness, not certainty about repayment.
Legal structures also determine how assets survive changes in family or corporate circumstances. Trusts, companies and foundations can separate day-to-day management from entitlement to benefits. Cross-border arrangements may serve legitimate commercial purposes, but complex ownership chains can also make accountability difficult. Holding an asset offshore does not, by itself, establish illegality.
For the wider public, the practical questions concern transparency and responsibility. Can the beneficial owner be identified? Are obligations recorded accurately? Can a conflict of interest be challenged? Are public assets administered for public purposes? The quality of these arrangements affects both the safety of wealth and the distribution of power attached to it.
The institutions that set the terms of wealth
No institution runs the world economy. Even the most influential bodies occupy only one layer of a much larger structure. A national parliament can change a tax law; its central bank can adjust monetary conditions; its courts decide what a contract means; and its securities regulator can sanction misconduct. Cross-border bodies coordinate a part of this rulemaking, but seldom replace sovereign decision-making.
Policy influence is not evenly distributed. Some governments issue reserve currencies and host dominant financial markets. Some have larger voting shares at international institutions. Low-income borrowers can have limited bargaining power in a debt restructuring. The public architecture is consequently a mixture of cooperation, representation, national interest and commercial leverage.
The distinctions are documented in the IMF’s three-part mandate, the World Bank’s description of IBRD, the BIS mandate and the FSB’s coordinating role. These institutions matter immensely, but claiming that one of them secretly controls all global wealth would misunderstand both their mandates and the dispersed nature of property rights. 46
The place where value is produced is not necessarily the place where it is owned, taxed or ultimately enjoyed.
How wealth is distributed and inherited
Distribution begins before a government taxes income. It begins with access to land, education, employment, finance and ownership. It continues through the wages people can negotiate, the prices they pay and the risks they must carry. Taxation and public spending then modify the outcome.
The World Inequality Report 2026 estimates that, in 2025, the wealthiest 10 per cent of adults held about 75 per cent of global personal net wealth. The bottom half held about 2 per cent. These are estimates of financial and non-financial assets less debt. They are not measures of ownership of all public resources or of people’s human capabilities.36
What does the poorest half own in different regions?
View underlying figures and measurement notes
| Category | Value |
|---|---|
| East Asia | 5% |
| South and Southeast Asia | 5% |
| Europe | 3% |
| Latin America | 3% |
| Russia and Central Asia | 3% |
| North America and Oceania | 1% |
| Middle East and North Africa | 1% |
| Sub-Saharan Africa | 1% |
World Inequality Report 2026. Bottom half share within each region, not of global wealth.
Share of each region’s household net wealth held by its bottom 50% of adults. All readings are small; the chart uses a 0–10% scale to make the differences legible.
Two families with similar earnings may therefore have very different room to manoeuvre. One owns a home and has savings. The other pays rent and services debt. A period of unemployment imposes different pressures on them. The first family may be able to finance training, support a child or wait for a better job. The second may need immediate income on almost any terms.
Ownership also affects the ability to take risks. Existing assets can provide collateral. Savings allow an enterprise time to develop. Connections can bring information and introductions. Success then produces resources that can be reinvested or transferred to children. Inheritance carries advantage through assets and through earlier support with housing, education and business formation.37
That process is not mechanically identical everywhere. A modest inheritance may greatly improve the position of a household with little wealth. Broad home ownership and funded pensions can spread asset ownership. Public education and health services can reduce disadvantages that private balance sheets do not fully capture. Differences between countries show why policy and institutional history matter.
Gender belongs in this account. Unpaid care sustains households and makes paid work possible, yet the people performing it may accumulate fewer independent earnings and pension rights. The ILO documents how unequal care responsibilities restrict economic opportunities, particularly for women.38
The tools for widening participation include better public services, more competitive markets, fairer access to credit, stronger labour institutions and well-designed taxation. Each has costs and practical difficulties. A tax that is easy to avoid may collect little. A subsidy may be captured by people who need it least. An ownership reform may fail if records and enforcement are weak.
The serious question is how to preserve incentives to build useful things while preventing inherited advantage, coercion or restricted competition from closing opportunity to others. Distribution and production influence each other. A population denied health, learning or economic security also loses some of its capacity to produce.
Personal wealth growth in 2025, measured in US dollars
View underlying figures and measurement notes
| Category | Value |
|---|---|
| Europe, Middle East and Africa | 17.5% |
| Americas | 8.5% |
| Asia-Pacific | 5.9% |
UBS Global Wealth Report 2026. Nominal US dollar growth; exchange rates affect comparisons.
The average can hide the typical experience
Averages rise with large fortunes. Compare mean and median personal wealth per adult across three selected economies.
Switzerland
United States
Australia
What the gap means. The median identifies the middle adult, while the mean responds strongly to very large fortunes. Their difference is informative but is not, by itself, a complete measure of inequality.
Where the world’s wealth is held
Wealth can be located in three different ways, and those locations do not always coincide. The first is where an asset physically stands: a house in Toronto, an oil field in the Gulf or a semiconductor plant in Taiwan. The second is who owns the claim: a household, business, government or investment fund, possibly resident on another continent. The third is where that claim is legally registered, administered or traded. Confusing these locations produces misleading maps of economic power.
For private household balance sheets, the most comprehensive available comparisons are estimates rather than a worldwide census. UBS’s 2026 report analyses 56 markets, representing more than 92% of estimated personal wealth. It reports that global personal wealth rose 10.8% in US-dollar terms in 2025. Growth varied by region, partly because currency moves alter the dollar value of non-dollar assets. The United States and mainland China together account for more than half of global personal wealth, according to this estimate. 42
One country holds more than a third of estimated personal wealth
View underlying figures and measurement notes
| Category | Value |
|---|---|
| United States | 35.7% |
| Other economies | 64.3% |
UBS Global Wealth Report 2026. US share of covered worldwide personal wealth; other economies are an arithmetic residual.
Share of personal wealth in the markets covered by UBS’s global estimate
The US and mainland China together hold more than half of global personal wealth. Different legal definitions, currencies and the valuation of unlisted assets complicate country comparisons.
Average national wealth per adult tells only part of the story. In the United States, UBS reports average wealth of about $696,000 per adult but median wealth of about $69,000. The gap reflects the influence of the richest households on the average and the concentration of business and financial ownership. Switzerland also has a high average but a far lower median. These country figures are not direct measures of income, public wealth or living standards.
For international investments, ownership can become still more remote. A retirement saver in one country may own a unit in a fund domiciled in another. The fund might purchase shares listed in a third country in a corporation whose factories are scattered around the world. Each layer has its own legal claims, custodians and exposures. Wealth is not simply moved across the map in crates; much of what circulates internationally is an enforceable claim on future income or assets.
Where international investment actually lands
Foreign direct investment is one useful window into this geography, although it is neither the whole of cross-border finance nor a pure measure of new factories. UNCTAD’s World Investment Report 2026 estimates that global FDI flows rose 6% to $1.6 trillion in 2025. Developing economies received about $901 billion, while the world’s top 20 host economies attracted more than 80% of overall inflows. The rebound was narrow, with investment especially prominent in strategically important digital infrastructure. 43
Investment inflows are geographically concentrated
View underlying figures and measurement notes
| Category | Value |
|---|---|
| Developing economies | $901bn |
| Developed economies | $723bn |
UNCTAD World Investment Report 2026. Rounded 2025 FDI inflows; not identical to new productive investment.
of global FDI went to the 20 largest host economies in 2025.
Three different transactions can produce very different economic effects. When a company builds a new plant abroad, capital helps create equipment, jobs and productive capacity. When the same company buys an existing foreign competitor, ownership changes but the immediate addition to factories may be small. When an investor buys a government bond or a listed share without obtaining control, that is generally portfolio investment rather than direct investment. The flows are recorded in different categories because they create different obligations and degrees of influence.
Financial centres further complicate the picture. A legal entity may hold securities in one jurisdiction while the business using the money operates in another. Holding-company and conduit structures can make cross-border investment statistics difficult to interpret as a simple map of where economic activity occurs. The legal location of a claim, the place where a tax liability arises and the geography of production must be analysed separately.
Capital can also travel in both directions. Exporters accumulate payments, importers borrow to finance purchases, banks extend credit and investors purchase assets abroad. A country can receive investment and send savings overseas at the same time. Gross flows reveal how intensely its financial system is connected; the net balance records a different outcome. Neither on its own answers whether capital is building resilient productive capability.
An acquisition of an existing company can count as FDI even when it does not directly finance new production. Conversely, a company may build a factory with domestic finance, and international portfolio investors can finance other enterprises without obtaining control. The economically useful question is therefore not merely how much foreign capital entered, but whether it increased productive capability, technology diffusion, resilience and durable income.
Digital assets and the limits of the balance sheet
In the contemporary economy, a firm’s most valuable resources may include software, research, design, brands, data or organisational knowledge. WIPO’s work on intangible investment tracks the growing importance of these assets. They can be difficult to measure and may not appear fully in conventional accounts.39
Some have unusual economics. Developing a programme can be expensive, while distributing an additional copy costs relatively little. A platform may become more useful as more people join it. These features can generate large productivity gains, but they can also favour firms that already control distribution, standards or access to customers.
Artificial intelligence extends these possibilities and dependencies. Its economic value will depend on useful applications, the cost of providing them and the institutions governing their use. Expectations about future profits can lift market valuations well before the benefits are established across the wider economy.

DrHughManning, Wikimedia Commons. CC BY-SA 4.0. Collection record.
Digital production still has material requirements. Chips, data centres and electricity systems require investment and skilled labour. The International Energy Agency’s analysis of energy and AI examines this relationship and the pressure that expanding computing demand can place on power systems.40
Digital tokens introduce different forms of recorded claims, but a token’s price does not by itself demonstrate new productive capacity. A token representing an existing asset changes how a claim is recorded or traded. Other tokens derive value from different expectations and uses. In each case, the rights and risks require examination.
The larger limitation is ecological. A balance sheet can record income from extracting a resource while failing to capture the full loss of an ecosystem. The Dasgupta Review on the economics of biodiversity argues for treating economic activity as embedded within nature and recognising the consequences of drawing down natural assets.41
Growth in production does not always preserve a nation’s wealth
View underlying figures and measurement notes
| Category | Value |
|---|---|
| Global real comprehensive wealth per capita, 1995-2020 | +21% |
| Countries with rising GDP per capita but falling real wealth per capita | >25% |
World Bank, Changing Wealth of Nations 2024. Different metrics and units; not additive.
Change in global real comprehensive wealth per person, 1995–2020
Share of countries with positive GDP-per-person growth but falling real wealth per person over the period studied
Restoring a watershed or preventing damage may protect enormous future value without generating a spectacular private fortune. Conversely, an enterprise can report profits while shifting part of its costs onto people outside the transaction. Wealth accounting becomes more informative when it asks whose benefits and whose losses have been included.
The rules are easiest to see when confidence fails and financial promises must be made good.
The moments when the architecture breaks
Financial systems are easiest to study when the payments stop working. In the Asian financial crisis of 1997 and 1998, borrowers and financial institutions with foreign-currency obligations faced severe pressure when exchange rates shifted and external finance withdrew. Where debts were in dollars but revenues were in local currency, depreciation inflated the burden of repayment. Exchange rates, banks and corporate balance sheets deteriorated together.
The global crisis of 2008 exposed another vulnerability. Mortgage-linked securities, short-term funding and opaque exposures connected households, banks and investors. When confidence in collateral and counterparties evaporated, institutions tried to obtain cash at the same time. The problem was not a shortage of houses alone. It was the fragility of the promises and financing structures layered on top of them.
In March 2020, the pandemic shock made even normally deep markets vulnerable to a rush for liquidity. Central banks intervened to preserve market functioning while governments supported businesses and household incomes. These episodes have different origins, yet they share one lesson. A bank deposit, bond, insurance promise or investment fund interest is valuable partly because the holder believes it can be converted into usable purchasing power when needed.
Regulation tries to make those expectations more reliable through bank capital, liquidity standards, supervision, deposit protection, clearing arrangements and resolution planning. It can reduce risk but not eliminate it. New vulnerabilities accumulate when finance outpaces the rules or when political and monetary incentives encourage excessive leverage.
These failures expose a basic feature of financial wealth. The owner of a bond has an asset; the issuer has a liability. A depositor expects money on demand; the bank may have funded longer-term loans with those deposits. The claims cannot all be converted into cash immediately unless the system has enough liquidity and confidence to bridge the timing difference. The financial architecture works by making promises credible, not by storing an equal pile of notes beside every promise.
It also explains why a crisis spreads beyond the organisation where it begins. One institution sells assets to raise cash, pushing prices lower. Falling prices weaken the collateral and capital of another. The second institution cuts credit, affecting customers and companies that had no role in the original speculation. Firms reduce employment and investment; governments confront weaker tax revenues and higher social needs. What began as a balance-sheet problem enters factories, households and public budgets.
The lesson is not that financial markets should be abolished. Finance can bring future investment forward, share risks and connect savers with productive enterprises. The more practical lesson is that the design of claims matters: their maturity, currency, leverage, ownership transparency, counterparty exposure and the legal arrangements for resolving failure. Those details decide whether a shock is absorbed locally or transmitted through the wider economy.
Conclusion: The claim and the real thing
Humanity did not begin by inventing money. It began by finding ways to survive, produce more than it consumed, store the difference and decide who could draw upon it. In the first known administrative accounts, a measure of grain was already both a physical resource and an entitlement. Thousands of years later, a pension, a share certificate or a sovereign bond records another entitlement, one that may reach across borders and generations.
That long history is not a simple march from barter to coins to digital money. Different societies developed overlapping institutions: land tenure, taxation, irrigation, credit, commercial law, public works, forced labour, merchant partnerships and industrial companies. Each created new possibilities for coordination, and each could distribute power unevenly. There has never been a single architect of global wealth. It is an accumulated system of legal choices, technological advances, economic interests, political struggles and human effort.
The central distinction is between the ability to produce value and the claim to receive its returns. A worker in one country may make a product whose brand is owned elsewhere. A port can make trade possible while its financial returns flow to investors across an ocean. An asset manager can hold a claim on a factory without operating it. None of this makes financial claims fictitious. A share can distribute business risk, a loan can finance equipment before its output arrives, and insurance can protect a family against catastrophe. Claims are indispensable tools, but they are not the same as the food, knowledge, infrastructure and ecological systems on which future prosperity depends.
Statistics capture only parts of that system. Household net worth can soar with house and share prices while access to shelter becomes harder for young families. GDP can expand as an aquifer is depleted. Foreign investment can rise because ownership has changed hands, without an equivalent increase in production. Reading these numbers responsibly requires asking what each measures, whose balance sheet records the change and which costs are missing. A society can grow wealthier on paper while losing capacities that are difficult or impossible to replace.
The institutions that govern finance matter precisely because ownership is so dispersed. Governments establish and enforce rights. Central banks support monetary and financial stability. The IMF, World Bank, BIS and other institutions coordinate distinct parts of the international system, but none commands global wealth. Investors, companies, households and workers constantly renegotiate the practical distribution of its gains and risks. There is no durable answer that excludes markets or ignores public institutions. Prosperity depends on the way they interact, and on whether people can participate in the opportunities they create.
The next tests are already visible. Artificial intelligence and advanced manufacturing may raise productivity while concentrating intellectual property and computing capacity. Clean energy investment can create valuable assets while displacing older ones. Climate damage can destroy capital that accounting systems historically undervalued. Ageing populations, public debt and geopolitical fragmentation may alter who can save, lend, inherit or insure. Outcomes will depend less on a single technology or currency than on the incentives and institutions surrounding them.
The ultimate test of wealth is not only the price someone will pay for an asset today. It is what that asset, and the institutions around it, allow people to produce, preserve and pass forward tomorrow.
Sources and methodology
Editorial method: visual chapters are organised by economic mechanism rather than chronology alone. Household net worth, national productive capital and foreign direct investment refer to different statistical concepts and are deliberately not added together. Historical examples describe selected documented cases and do not claim to represent all regions or all periods. Figures preserve their source observation dates.
This article follows selected institutions and turning points across regions rather than proposing one universal sequence of development. Museum records, archival material, institutional research and economic-history scholarship support the historical examples. The comparison of institutions and the connections drawn between them are editorial analysis. The manufacturer example is illustrative.
Modern distribution figures refer to 2025 estimates published in the World Inequality Report 2026. They measure personal net wealth and are not directly comparable with the World Bank’s broader comprehensive wealth concept. Ancient evidence is incomplete, particularly where texts cannot be read or household wealth must be inferred from physical remains. Historical materials compiled on 1 October 2026; relevant current datasets reviewed again through 9 October 2026.
Data refresh and scope: narrative and the new charts were checked through 9 October 2026. Household personal-wealth estimates primarily reference calendar 2025; FDI is for 2025; foreign-exchange turnover is April 2025 and FX reserves are 2026 Q2. Wealth, GDP, trade, turnover and investment flows have different definitions and must not be read as interchangeable.
- The Metropolitan Museum of Art | Administrative account concerning barley and emmer. Object 1988.433.2, about 3100 to 2900 BCE. The museum qualifies the interpretation of the early signs.
- World Bank | The Changing Wealth of Nations 2024. Comprehensive wealth accounting distinguishes produced, natural and human capital and net foreign assets from annual production.
- Kohler and colleagues | Greater post-Neolithic wealth disparities in Eurasia than in North America and Mesoamerica. Nature, 2017. Archaeological comparison using house size as a proxy; this is not a complete inventory of ancient wealth.
- The Metropolitan Museum of Art | Model of a Granary with Scribes. Object 20.3.11, about 1981 to 1975 BCE. Curatorial account describes storage, measuring and accounting.
- The Metropolitan Museum of Art | Indus stamp seal and modern impression. Curatorial record on Harappan seals and the undeciphered script; related Met educational material documents trade with Mesopotamia. Related source.
- The Metropolitan Museum of Art | Roman Art A Resource for Educators. Background on agriculture, daily life and slavery in the Roman world.
- NCERT | Peasants Zamindars and the State. Themes in Indian History, Part II. Agrarian society, Mughal revenue institutions and the distinction between assessed and collected revenue.
- British Museum | Money Gallery guide. Coinage and other monetary traditions across regions, including western Asia, India and China.
- Smithsonian National Museum of the American Indian | A Road for Administration. The Great Inka Road exhibition. Read alongside Building the Road for labour obligations. Related source.
- Elinor Ostrom | Nobel Prize lecture on economic governance. 2009 lecture and associated Nobel materials on the governance of common resources.
- World Bank | Maximizing Social Impact Through Waqf Solutions. Historical social uses of endowed assets, including education and health care.
- The Metropolitan Museum of Art | The Trans-Saharan Gold Trade. Gold, coinage and commercial connections involving Ghana, Mali and North Africa.
- UNESCO | About the Silk Roads. Land and maritime networks, successive intermediaries, knowledge exchange and silk production.
- Victoria and Albert Museum | Indian textiles. India’s export networks and the effects of industrialisation and colonial trade policy.
- Reserve Bank of India | Indigenous Banking and Hundies. Monetary Museum material on remittance and credit instruments.
- Zamir Iqbal | Islamic Financial Systems. IMF Finance and Development, June 1997. Background on commercial partnerships and profit sharing.
- Columbia University Asia for Educators | From Copper Coins to Paper Notes. Merchant receipts and government-issued paper currency under the Song. The illustrated Ming note belongs to a later dynasty.
- The Metropolitan Museum of Art | The Manila Galleon Trade. Asian goods exchanged for New World silver through the Manila galleon network.
- UNESCO World Heritage Centre | City of Potosi. Silver production, hydraulic infrastructure and forced Indigenous labour under the colonial mita.
- University College London | Legacies of British Slave-ownership. Research based on compensation records. The 1833 settlement allocated 20 million pounds to owners, rather than compensating the formerly enslaved.
- National Archives of India | Our Heritage. Archival description of the farman dated 12 August 1765 granting the East India Company the diwani of Bengal, Bihar and Orissa.
- Gelderblom de Jong and Jonker | The Formative Years of the Modern Corporation. The Journal of Economic History, 2013. The VOC’s corporate form evolved through piecemeal institutional changes.
- Bank of England | The original government loan of 1694. The original loan was 1.2 million pounds. A separate Bank record identifies tonnage and excise taxes as its security. Related source.
- Science Museum | James Watt and the separate condenser. Steam-engine improvements, fuel efficiency and wider industrial uses.
- Meisenzahl and Mokyr | The Rate and Direction of Invention in the British Industrial Revolution. Research on technical improvement, incentives and institutions.
- Library of Congress | Lewis Hine photograph of a spinner in Lancaster Cotton Mills. 1908 photograph in the National Child Labor Committee Collection; digital identifier cph.3a20279.
- International Labour Organization | From Bismarck to Beveridge. Historical development of social insurance and social security.
- IMF | A Study of the Soviet Economy and Lessons from a Decade of Transition. Read alongside Mitra and Selowsky, Finance and Development, June 2002, on transition, insiders and the quality of institutions. Related source.
- World Bank | A Resurgent East Asia. Outward-oriented growth, human capital and economic governance. Country experiences differ.
- World Bank Group Archives | Bretton Woods and the Birth of the World Bank. July 1944 conference and its institutional outcomes.
- Federal Reserve History | Launch of the Bretton Woods System. Dollar-gold arrangements, the 1971 suspension and the move to floating major currencies in 1973.
- Bank of England | Money creation in the modern economy. Quarterly Bulletin, 2014. Bank lending creates deposits, subject to economic, regulatory and monetary constraints.
- IMF | Current Account Deficits. Savings, investment, external financing and vulnerabilities. Accounting relationships should not be mistaken for a single country’s coordinated strategy.
- World Bank | World Development Report 2020. Trading for Development in the Age of Global Value Chains.
- BIS and IOSCO | Principles for Financial Market Infrastructures. Payment systems, securities depositories, settlement systems, central counterparties and trade repositories.
- World Inequality Lab | World Inequality Report 2026. 2025 estimates: top 10 per cent about 75 per cent of personal net wealth; bottom 50 per cent about 2 per cent. Chart residual of 23 per cent is calculated for the middle 40 per cent from rounded published shares. Global aggregation follows the report’s PPP convention. Related source.
- OECD | Inheritance Taxation in OECD Countries. 2021 research on household assets, gifts and inheritance, including differing effects on absolute and relative inequality.
- International Labour Organization | Care work and care jobs for the future of decent work. Relationships between unpaid care, paid employment and gender inequality.
- WIPO and Luiss Business School | World Intangible Investment Highlights 2026. Intangible assets include research, software, data, brands, design and organisational knowledge. The article does not extrapolate the report’s covered economies into an all-country total.
- International Energy Agency | Energy and AI. 2025 special report on computing, data centres and energy systems. No forecast is presented here as an observed result.
- HM Treasury | The Economics of Biodiversity The Dasgupta Review. 2021 independent review of the relationship between economies and nature.
- UBS | Global Wealth Report 2026. Press release, 30 June 2026. Reports 2025 USD-denominated household personal-wealth changes, mean and median wealth per adult, and coverage of 56 markets.
- UNCTAD | World Investment Report 2026, released 7 July 2026. 2025 FDI flow estimates, sectoral and geographic concentration; FDI not identical to new productive capital formation.
- IMF | Currency Composition of Official Foreign Exchange Reserves, second quarter 2026. Data brief 30 September 2026; shares reflect official foreign-exchange claims, not gold or total international transactions.
- BIS | Triennial Central Bank Survey, 2025 FX turnover, results published 30 September 2025 and final data released June 2026. April 2025 FX turnover was approximately $9.5 trillion per day in the final release; FX turnover is not GDP.
- IMF, World Bank, BIS and Financial Stability Board | Official institutional mandates and governance. See source links in institution section.
- World Inequality Lab | World Inequality Report 2026 executive summary. Global distribution of personal net wealth: top decile about 75%, bottom half about 2%.
- World Bank | The Changing Wealth of Nations 2024. Broader produced, natural, and human capital concepts differ from household net worth.
- World Inequality Report 2026: regional within-region shares of household net wealth owned by the bottom 50%, 2025
- World Bank, The Changing Wealth of Nations 2024: real comprehensive wealth per person and comparison with GDP, 1995 to 2020
- Unsplash License: permitted uses and third-party rights qualifications for editorial photography
Image credits
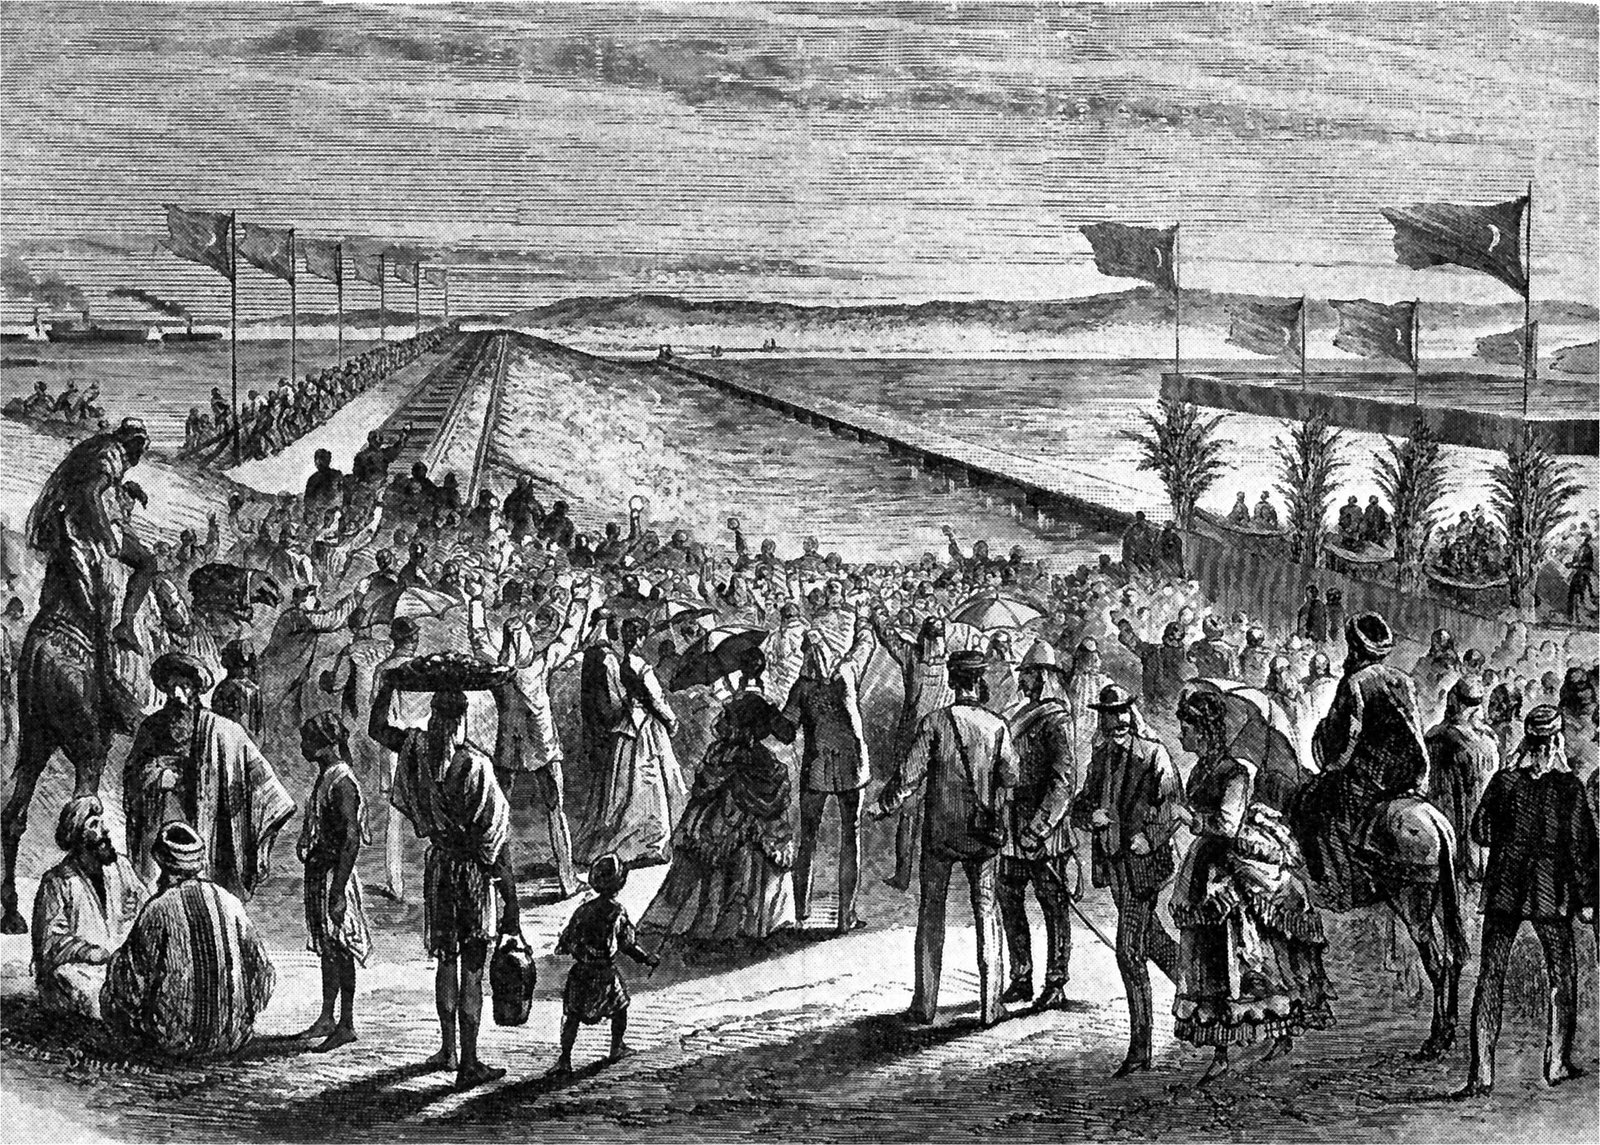
Suez Canal opening. Historical illustration, 1869, author unknown; public domain reproduction via Wikimedia Commons. Source.
Cover photograph. Wall Street, New York, by Lo Lo / Unsplash. The image is licensed under the Unsplash License, is hosted in the ALBORITHM Media Library and portrays an actual place. No endorsement by depicted parties is implied.
Tablet. The Metropolitan Museum of Art, object 1988.433.2. Purchase, Raymond and Beverly Sackler Gift, 1988. Public domain and Met Open Access CC0. Source and rights record. Displayed without editorial cropping or alteration.
Granary. The Metropolitan Museum of Art, object 20.3.11. Rogers Fund and Edward S. Harkness Gift, 1920. Public domain and Met Open Access CC0. Source and rights record. Displayed without editorial cropping or alteration.
Ming. Photograph by BabelStone, Wikimedia Commons. CC0 1.0. Source and rights record. Displayed without editorial cropping or alteration.
Voc. VOC document, Westfries Archief, via Wikimedia Commons. Public domain. Source and rights record. Displayed without editorial cropping or alteration.
Mill. Lewis Wickes Hine, National Child Labor Committee Collection, Library of Congress. Digital identifier cph.3a20279. Public domain; Library of Congress records no known restrictions on publication. Source and rights record. Displayed without editorial cropping or alteration.
Bretton. US National Archives and Records Administration, RG 208 Roll 211, via Wikimedia Commons. Public domain US federal government work. Source and rights record. Displayed without editorial cropping or alteration.
Ship. Hummelhummel, Wikimedia Commons. CC BY-SA 3.0. Source and rights record. Displayed without editorial cropping or alteration.
Wafer. DrHughManning, Wikimedia Commons. CC BY-SA 4.0. Source and rights record. Displayed without editorial cropping or alteration.
The distribution chart is an original ALBORITHM rendering of the cited estimates.
Subscribe to alborithm
Get new documentaries, articles and podcasts directly in your inbox.